New features on SpreadCharts: Move your curves!
Last time I said there are more things to come. And today, I have some great news regarding the app.
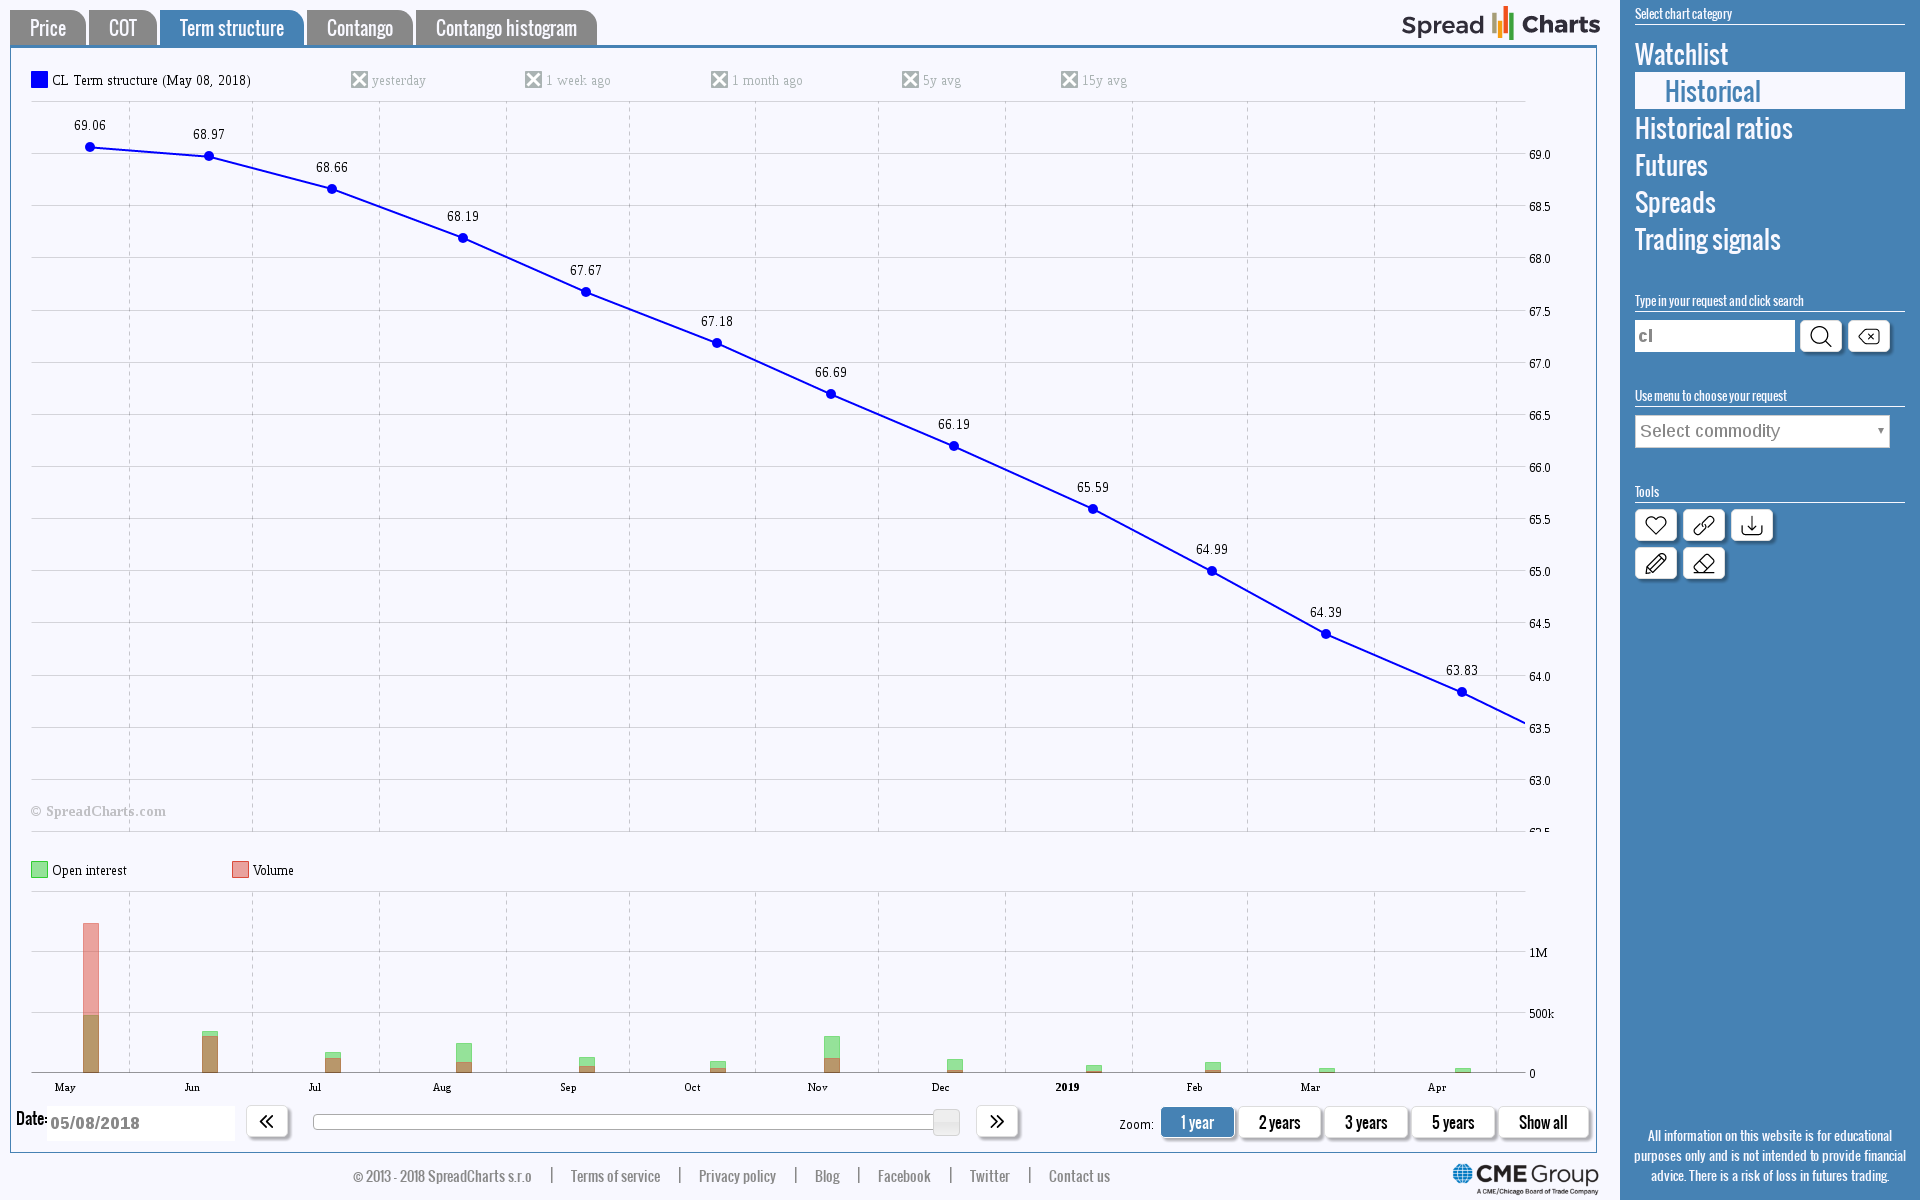
Imagine you select a random commodity and you’re allowed to see just a single chart. Which one would it be? Is it the price, COT or seasonality? Well, for me it would be the term structure chart without any doubt. It’s the chart that gives you the most information about a particular market. First of all it can tell you how balanced the supply/demand is, based on the fact whether the market is in contango or backwardation. Moreover, you can identify crops, heating seasons, slaughters, etc. from the rippling of the term structure.
But things really become interesting when you start observing how the term structure evolves over time. This brings me to the new features. We pushed the term structure analysis to another level. The changes are as follows:
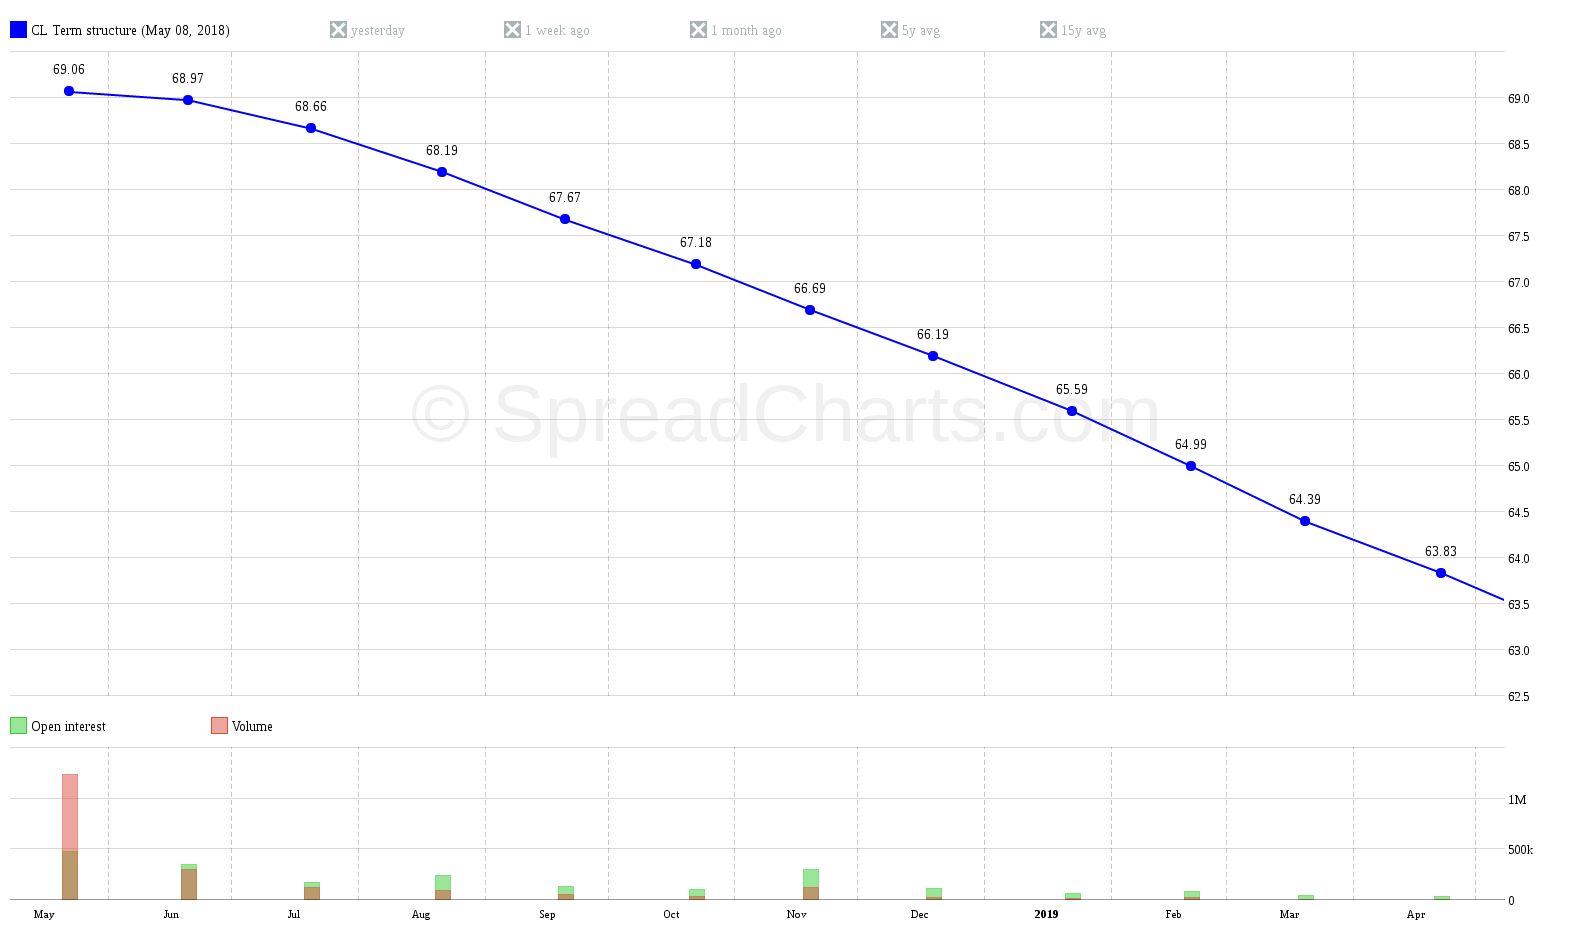
- Precise expiration dates – the x axis no longer denotes contract months. Instead it is now a time axis, where the beginning marks today and dates of the particular futures on the x axis mark exact expiration of each contract. We define expiration as the Last Trading Date (LTD). We calculate these dates for all the 61 markets in our database. The guides for each contract (when you hover over it) show you the ticker, price and exact time into expiration in days.
- Historical curves in one chart – compare the current curve with the historical curves yesterday, one week ago and one month ago. This way you can clearly see how the curve has shifted in absolute terms.
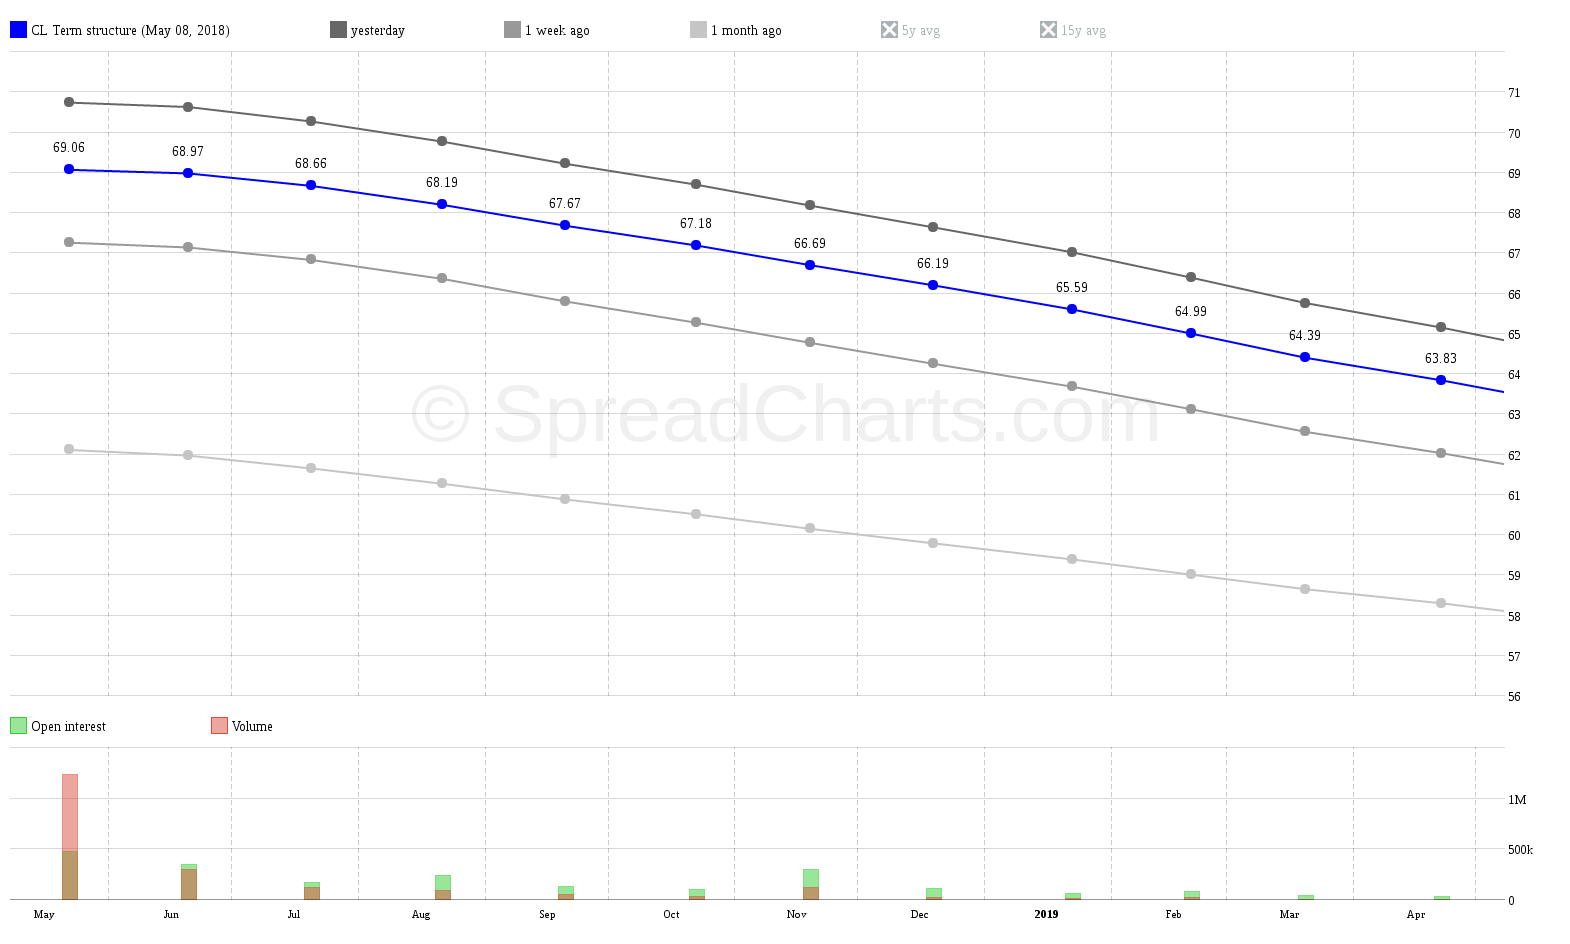
- Term structure seasonality – display the mean curve over the last 5 or 15 years. This will tell you what the mean prices for all futures were at this time of the year. Moreover, it shows you what the shape of the curve was most of the time. You can then compare all of this with the current curve.

- Move your term structure – and finally the best feature. Observe how the curve (and volume/OI) has changed over time. You can do this by using the left/right arrows beneath the chart. There’s also a very neat feature called slider. Just drag the square between the arrows and move it. You’ll see how the shape of the curve has changed over the past weeks. You can therefore see how the whole curve moves towards the left as the contracts approach expiration. If you want to look deeper into history (months/years), select the date using the calendar.
So these are the new features, just go to the app and check it out. We also solved a lot of minor bugs, which will make everyone happy.
P.S. As always, if you encounter any problems, we recommend you to clear your browser’s cache.
Check out also these great articles
Why trade SGX Rubber?
Last time, we introduced the SGX data in the SpreadCharts app and briefly described the...
Read moreIntroducing commodities in Singapore
We are thrilled to announce that we have obtained a license to distribute market data...
Read moreA bunch of new data
A bunch of new data has been added to the SpreadCharts app! This includes data...
Read moreLaunching an improved model for signals
I personally consider the signals generated by our AI model to be the cornerstone of...
Read more