The widow maker spread ended in slight backwardation
Unlike last year, when the widow maker spread expired in pretty wild backwardation, it finished yesterday in a quiet mood. But let’s explain a little bit about this spread. I’m talking about the interdelivery natural gas spread between March and April, NGH15-NGJ15.
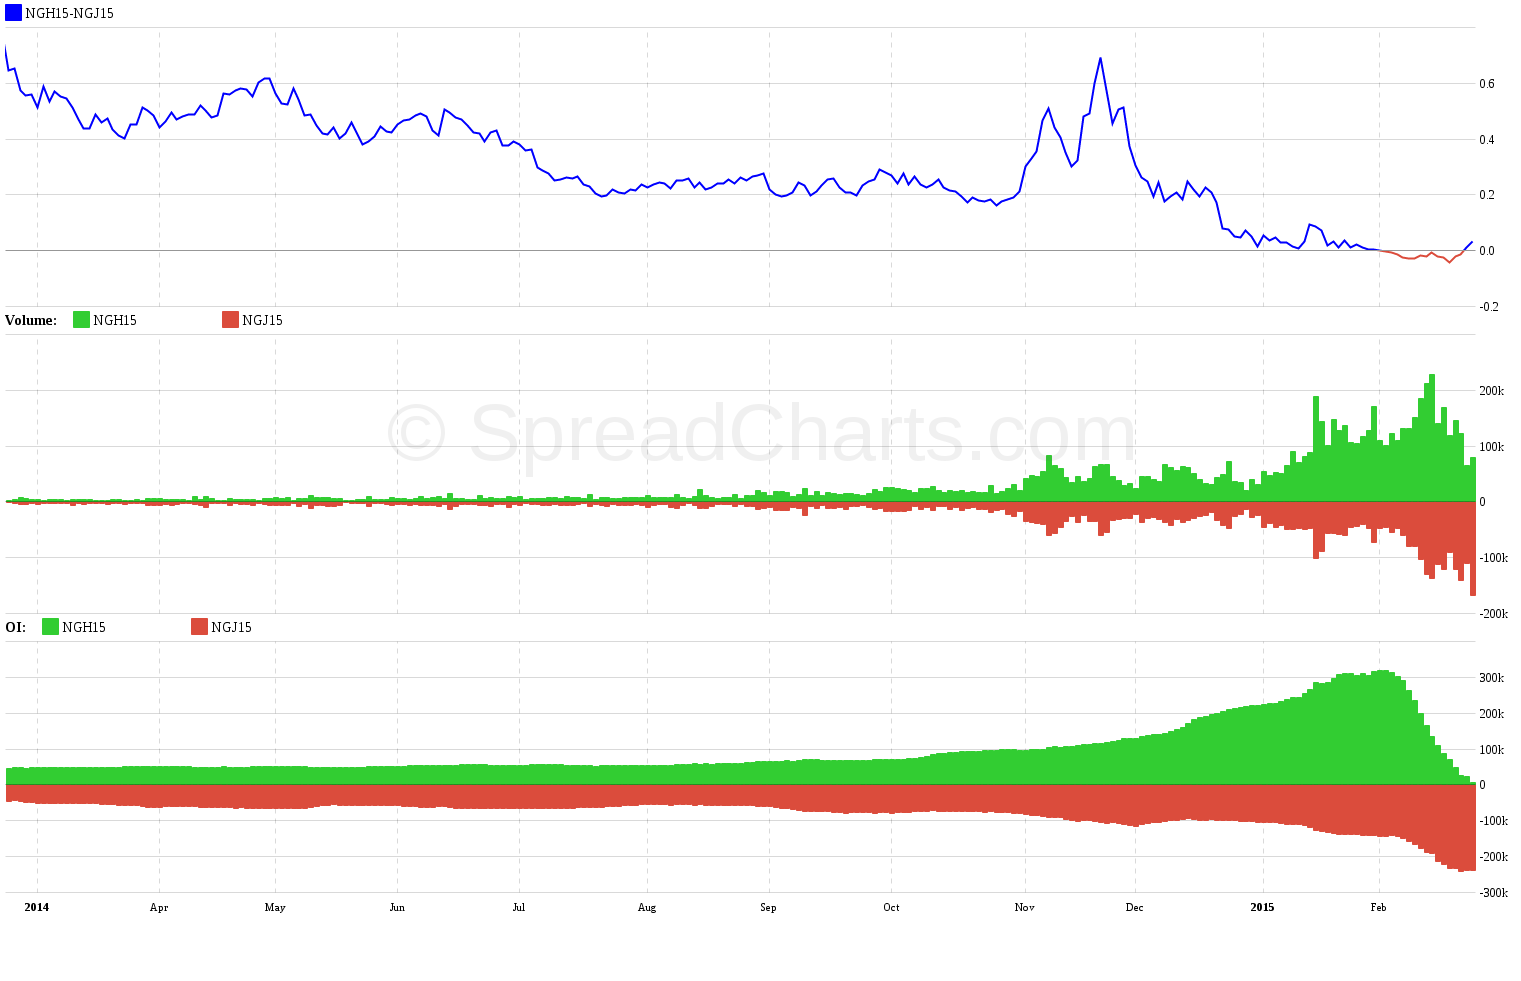
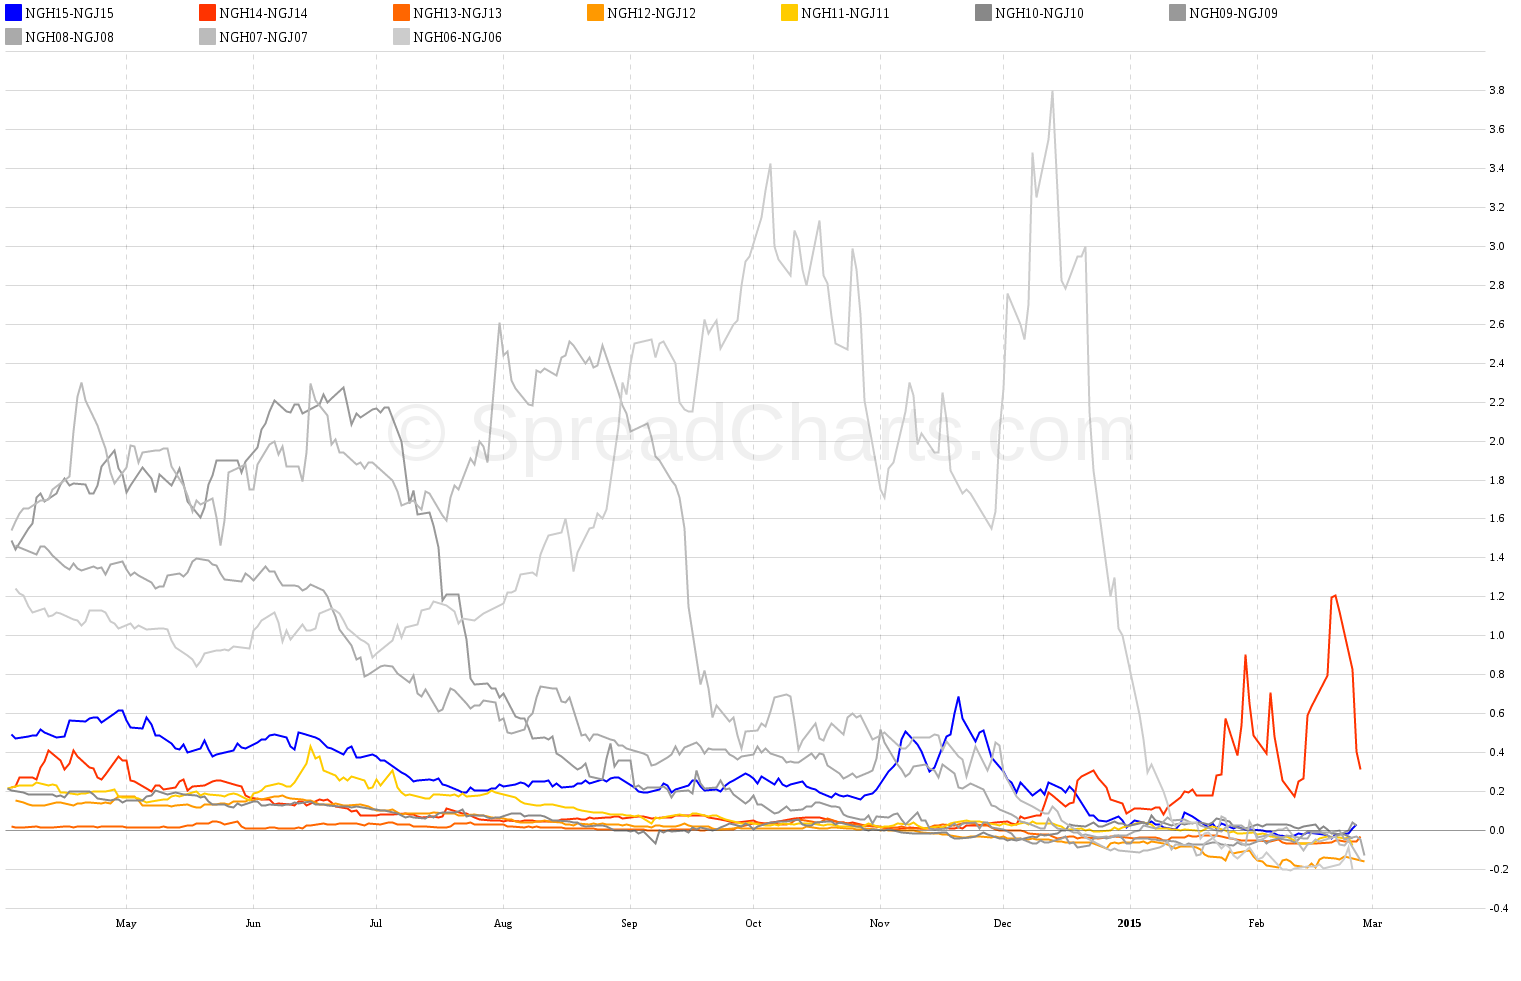
Consumption of natural gas is usually high in winter due to heating demand. Consumption is lower during the summer months but can spike due to abnormal heat. That’s because natural gas is used in gas power plants to generate electricity for air conditioners. However, the consumption is minimal during the shoulder season (spring and autumn) when there is neither heating nor cooling demand. The NGH15-NGJ15 spread reflects this relationship. Expiration of the March contract falls into the winter season, while expiration of the April contract falls into the shoulder season. When demand in winter is huge, the price of the March contract increases significantly more than the price of the April contract. That’s because the market assumes high demand reduces natural gas stockpiles of utilities, which then turns to the futures market in order to secure enough gas until the end of winter, no matter the price. This scenario can cause the spread to explode, inflicting huge losses to traders who are on the wrong side of the trade. The spread can be so volatile, it can bankrupt people or even hedge funds. Hence the name Widow Maker. You can see the volatility in the following seasonality chart:
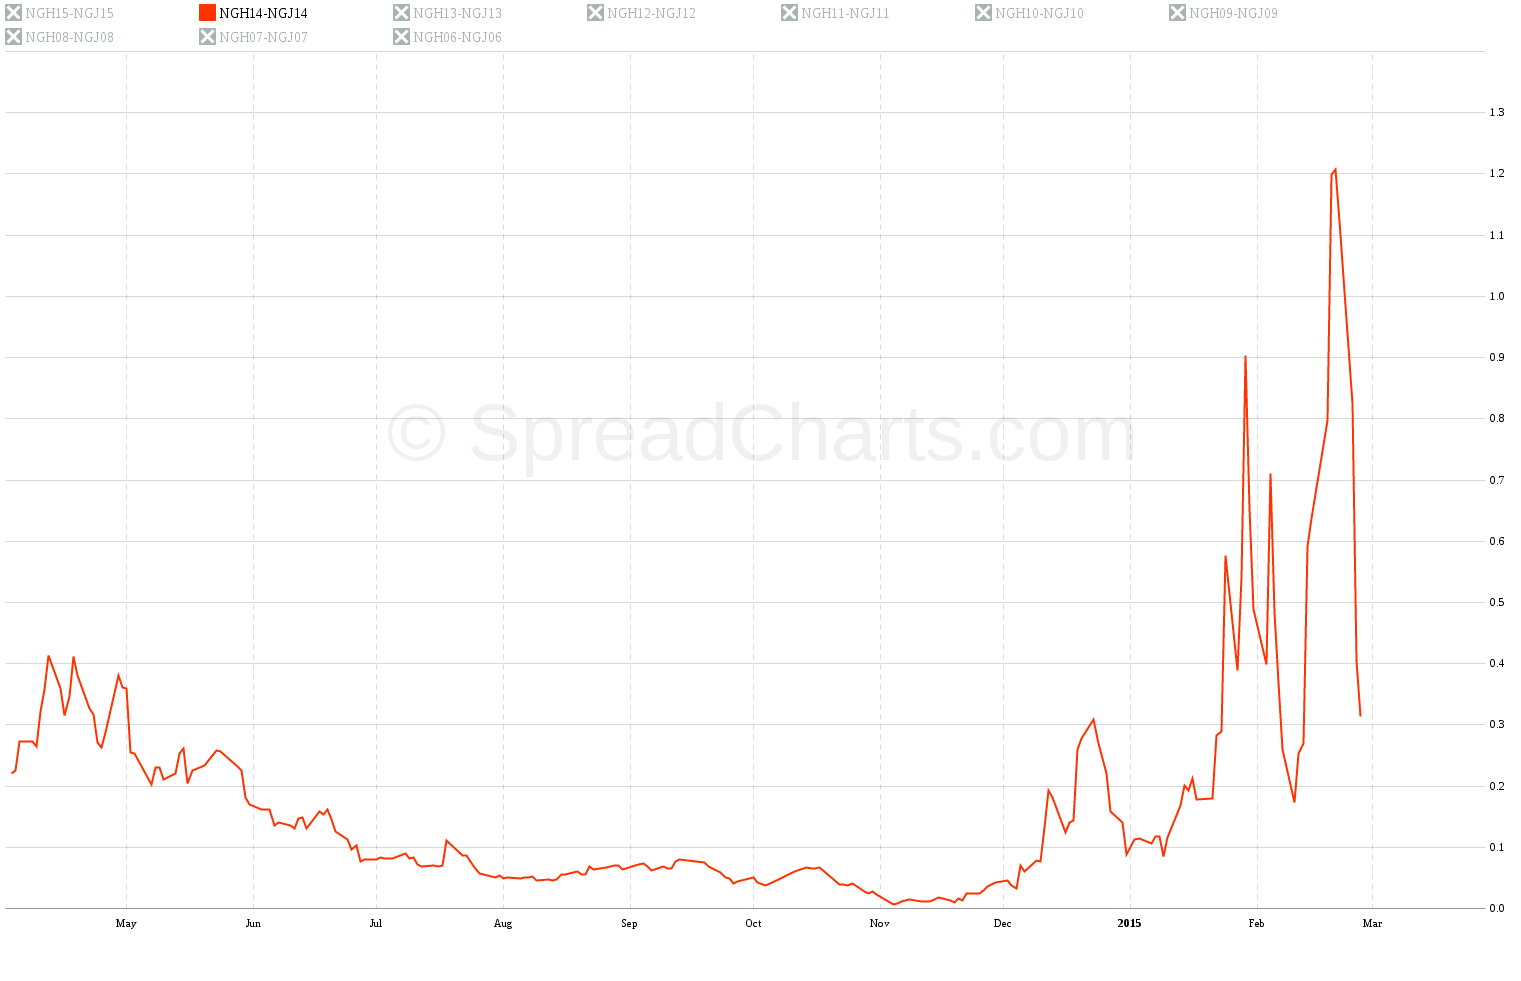
Last year was a great example why this spread deserves its name. The US and Canada experienced several polar vortices – inflows of arctic air mass down to the continental US. natural gas stockpiles were depleted to record lows. The situation didn’t get better even in the late winter. That’s why the spread ended in strong backwardation. It was especially wild a few days before the March expiration which caused huge losses to some energy hedge funds. I even heard a few funds had to shut down because of this spread. See the last year’s spread in the following chart:
Something similar happened in 2006 when Amaranth Advisors LLC hedge fund went bust after losing more than $6 billion. The fund’s principal trader, Brian Hunter, made bullish bets on natural gas using interdelivery spreads. His core position was in the 2007 widow maker March/April spread. Hunter was extremely overleveraged, so he brought down the entire fund when the trade went wrong. It made history as one of the largest hedge fund losses ever made. You can see the trade below:
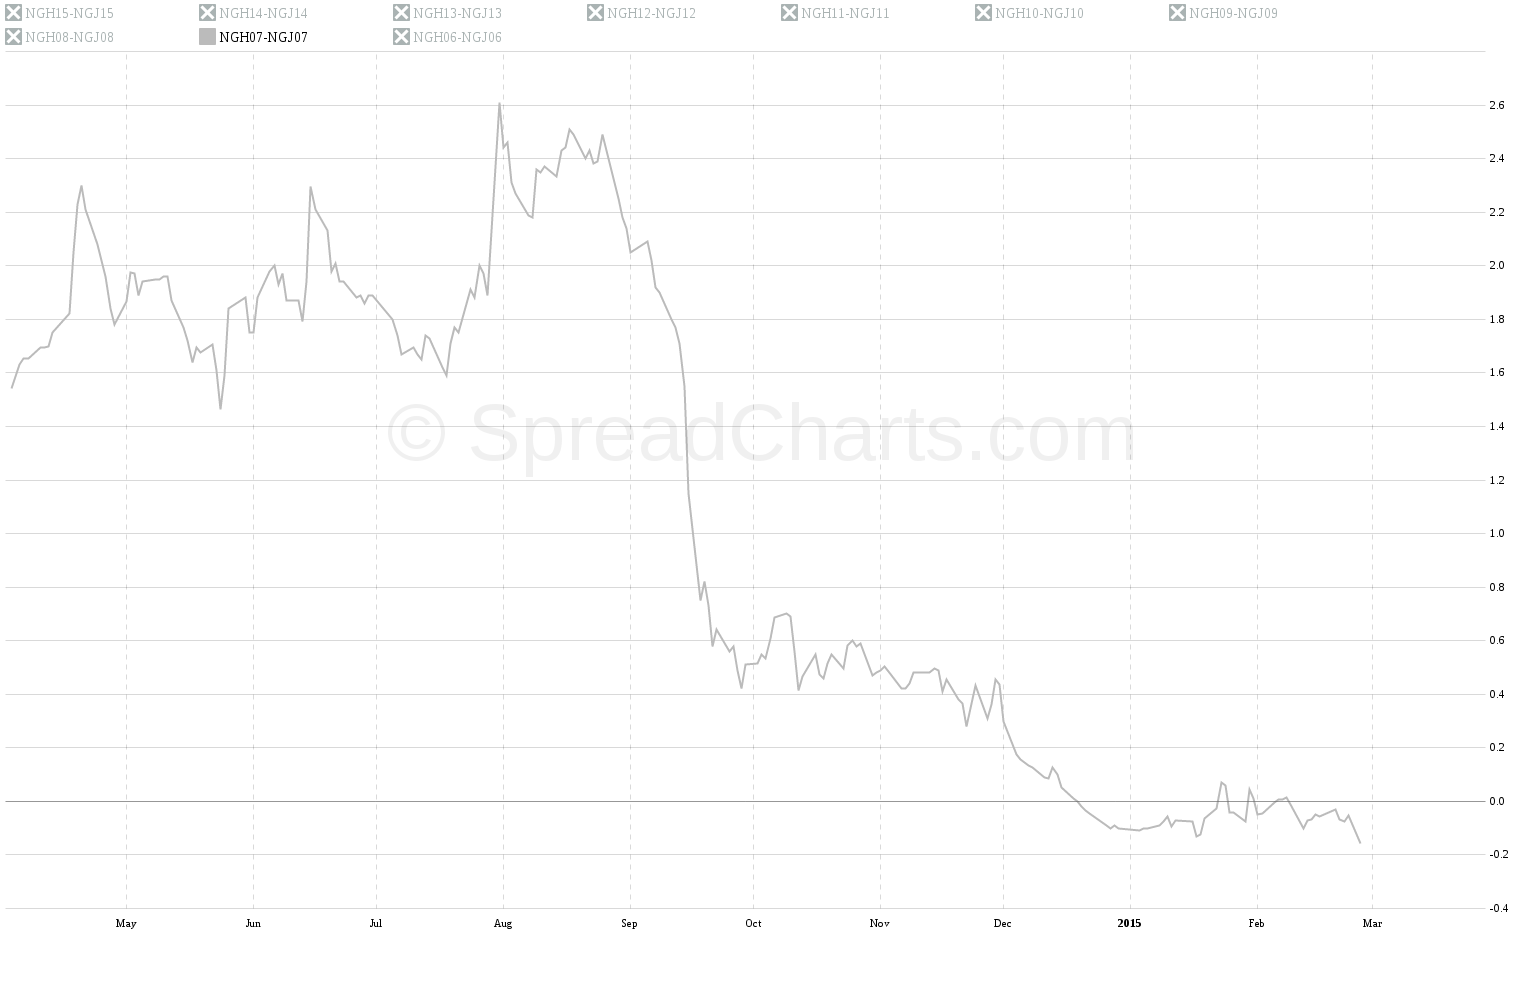
Hunter was bullish on natural gas hoping the tropical storms would shut down production. That happened in 2005 because of hurricane Katrina and led to a spike in the natural gas price. However, history didn’t repeat in 2006. Hunter was speculating the backwardation in the NGH07-NGJ07 spread would deepen. But storms in the summer of 2006 didn’t have a significant impact on natural gas production and the spread crashed in September as you can see on the chart above. Hunter’s positions were so enormous he wasn’t able to liquidate them, resulting in fatal losses.
Check out also these great articles
Why trade SGX Rubber?
Last time, we introduced the SGX data in the SpreadCharts app and briefly described the...
Read moreIntroducing commodities in Singapore
We are thrilled to announce that we have obtained a license to distribute market data...
Read moreA bunch of new data
A bunch of new data has been added to the SpreadCharts app! This includes data...
Read moreLaunching an improved model for signals
I personally consider the signals generated by our AI model to be the cornerstone of...
Read more