Wheat spread trade
I’m watching one CBOT wheat interdelivery spread. It’s ZWZ13-ZWN13. Seasonality is pushing the spread up:
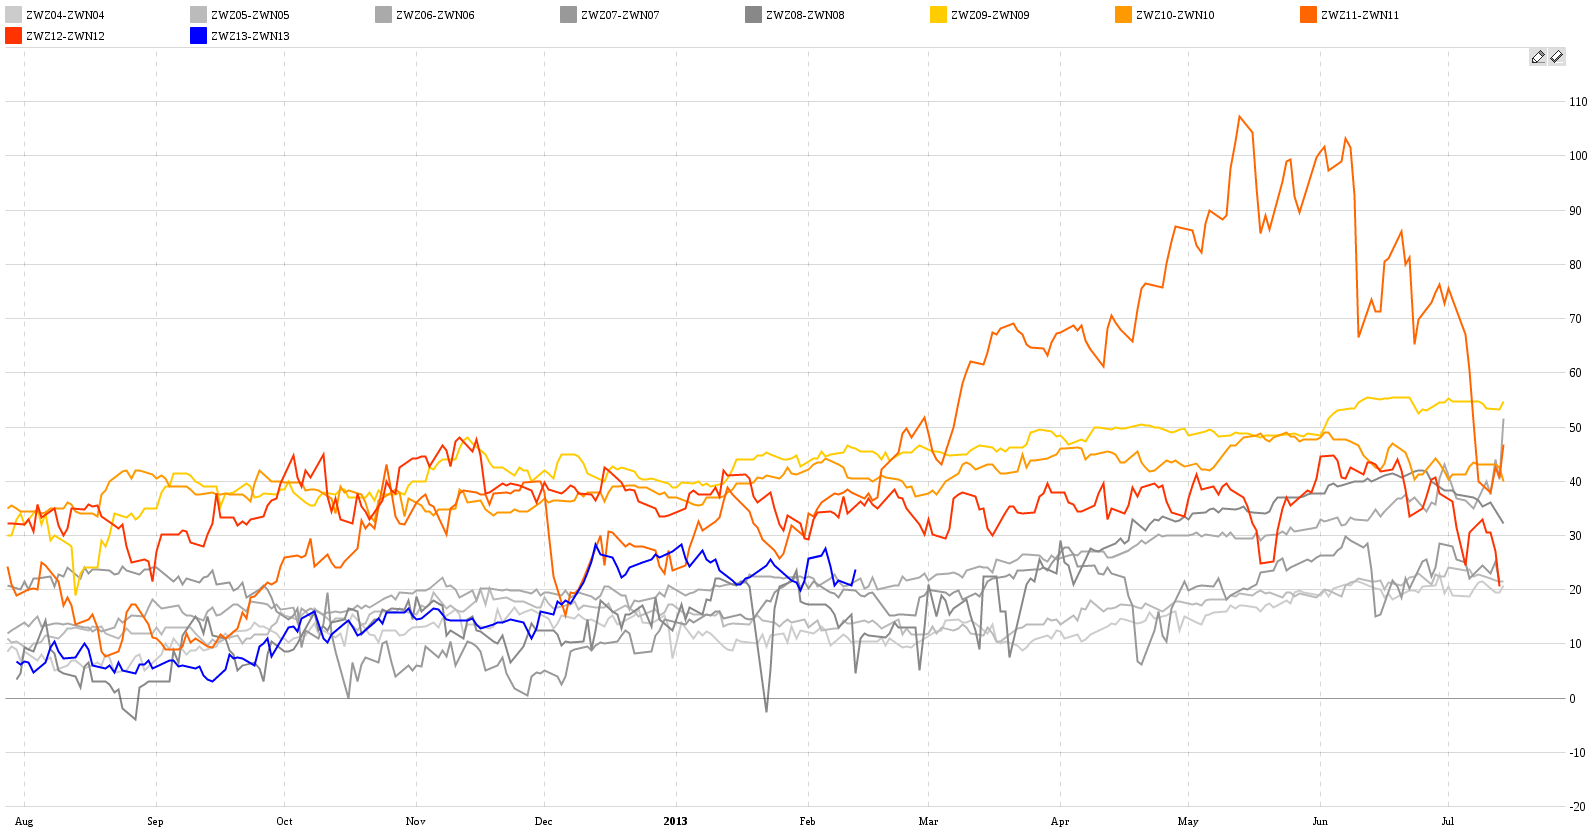
ZWZ11-ZWN11 was an abnormal year and it’s distorting our chart. Luckily in our app you can interact with charts and that includes our seasonality analysis. If you click on the ZWZ11-ZWN11 in the legend or the little orange square beside the writing, the ZWZ11-ZWN11 line will disappear from the chart and the whole chart will rescale. After doing so you will discover the spread is moving in a wide channel showing the seasonal uptrend.
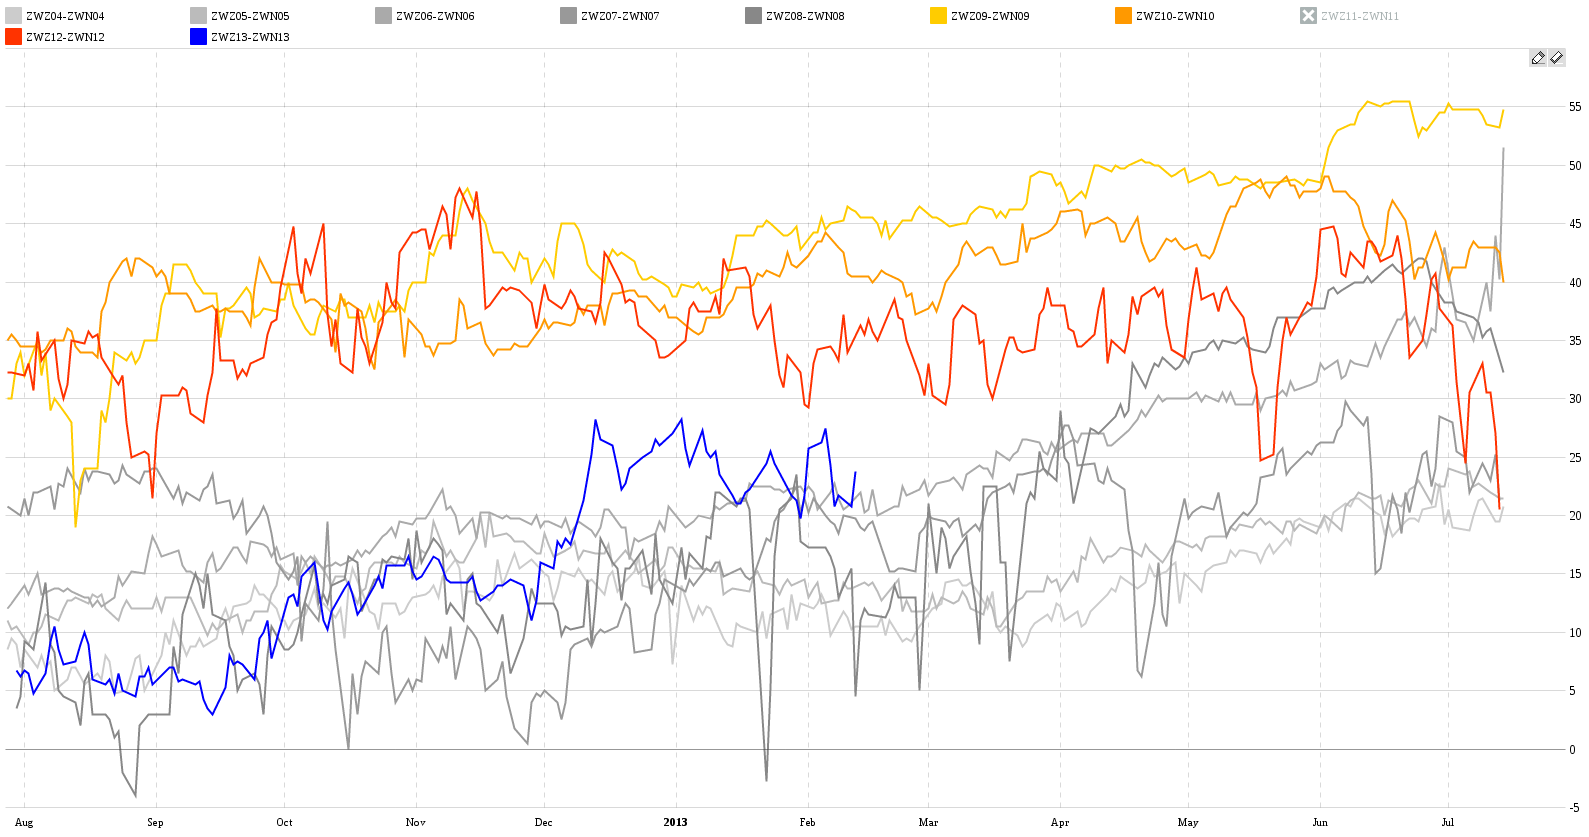
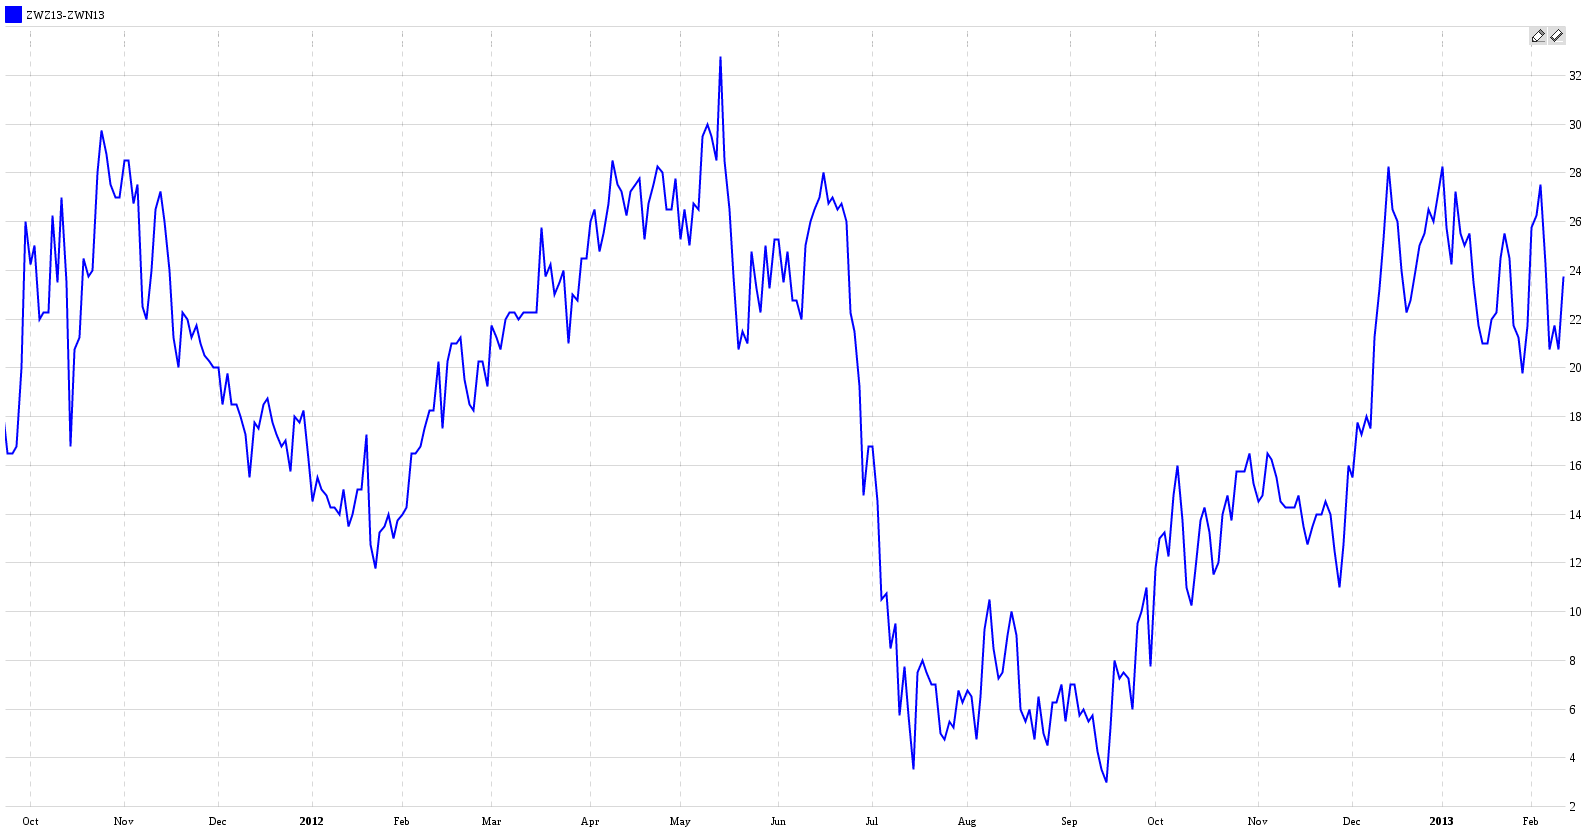
This year’s spread is currently near the middle of the channel. What makes me believe in entering the trade now is the technical pattern that has developed since mid-December. I would say it’s a flag pattern which is about to break higher. Therefore, I can safely place a stop-loss somewhere below 20c that would limit my potential loss. This creates a trading opportunity with nice RRR (risk-reward ratio). See for yourself:
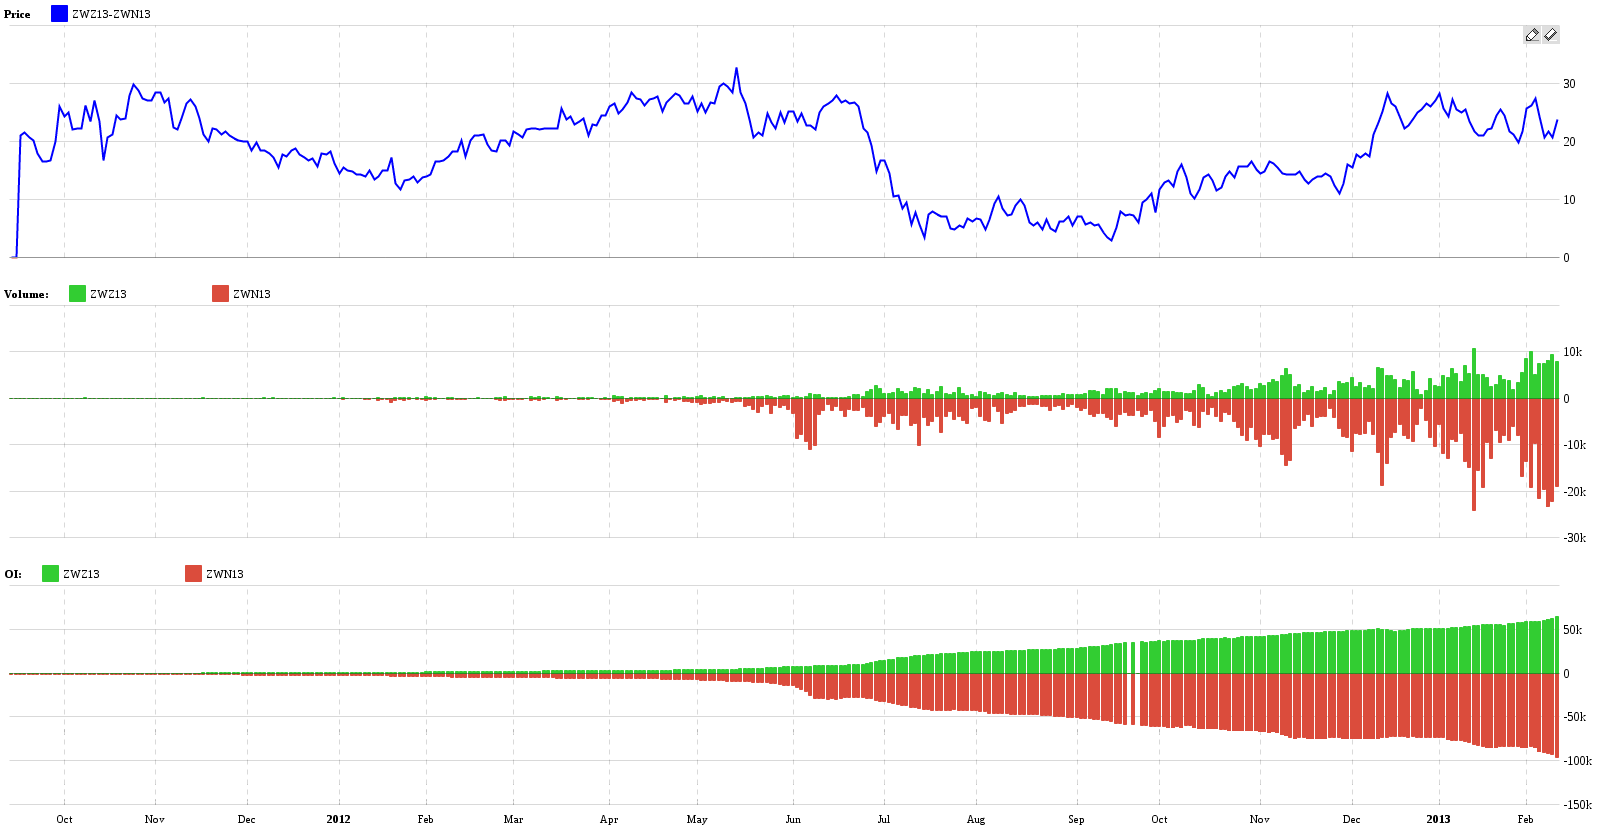
And as you can see from our volume analysis the spread is also very liquid. And has months to expiration.
Check out also these great articles
Why trade SGX Rubber?
Last time, we introduced the SGX data in the SpreadCharts app and briefly described the...
Read moreIntroducing commodities in Singapore
We are thrilled to announce that we have obtained a license to distribute market data...
Read moreA bunch of new data
A bunch of new data has been added to the SpreadCharts app! This includes data...
Read moreLaunching an improved model for signals
I personally consider the signals generated by our AI model to be the cornerstone of...
Read more