State of the crude oil market
Crude oil has come through a massive sell-off. There are three main causes that led to this situation. Most importantly is the oversupply caused by rising production in the US (fracking), other causes are a strong dollar (US economy in good shape) and weak international demand (China slowing down).
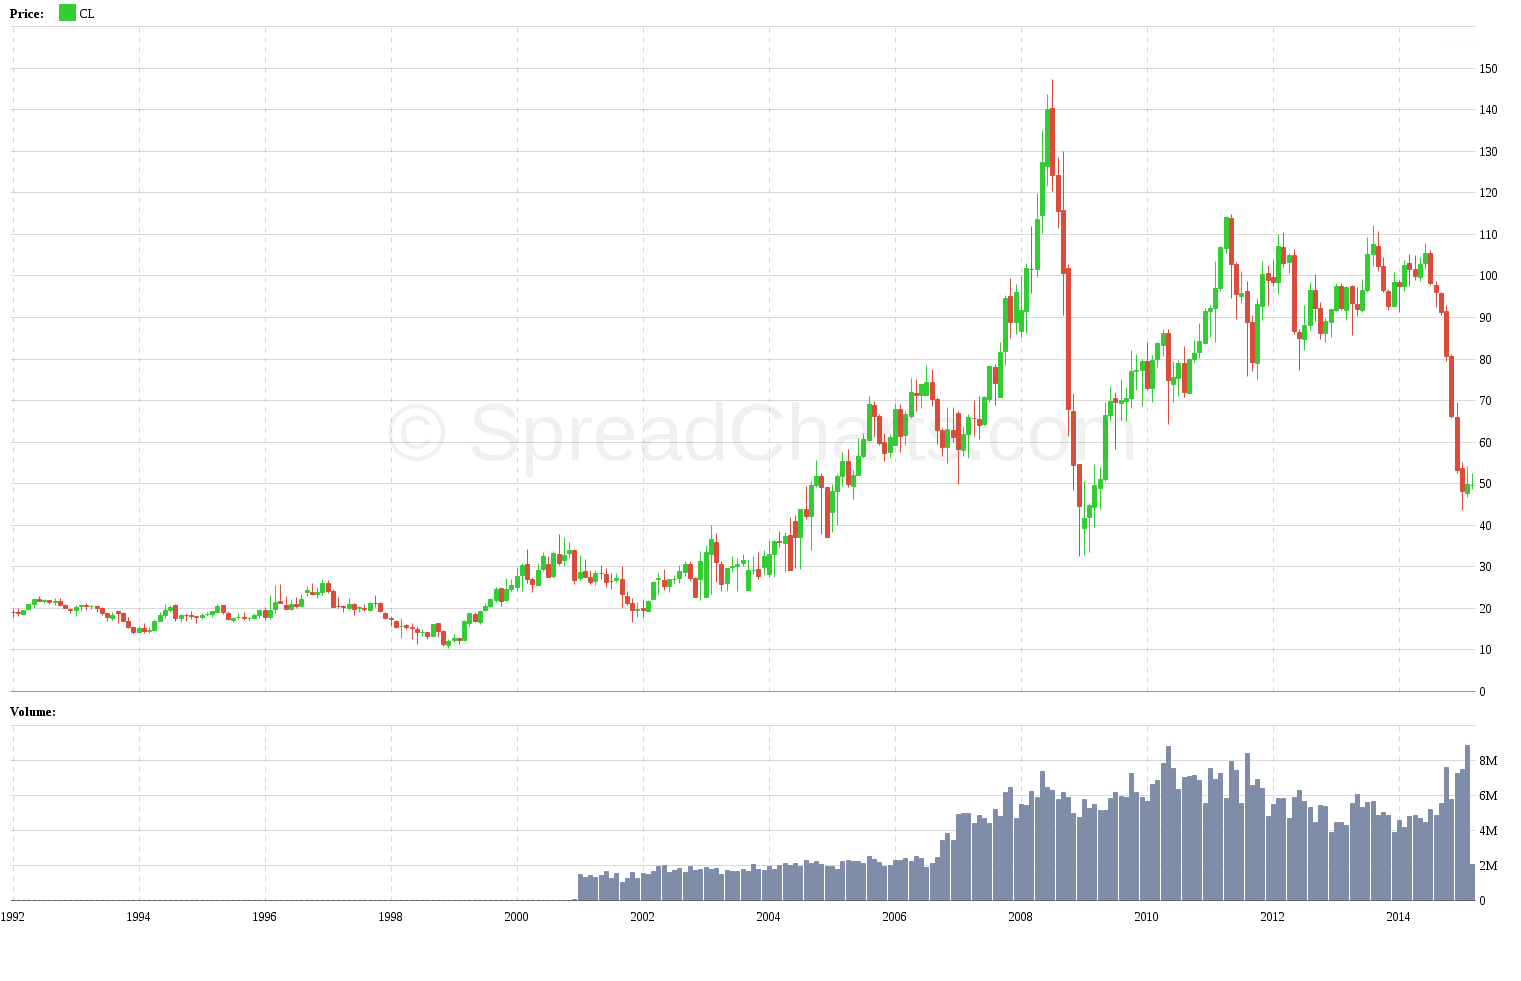
Although the current downturn is severe, it still pales in comparison with the collapse in 2008. It’s clearly visible in the continuous futures monthly chart:
Has the market fallen way too far? One can analyze fundamental conditions in crude oil, but I won’t delve into it. There’s a lot of other sources about the current supply/demand situation. Instead, I will focus on the structure of the futures market on NYMEX. Everybody knows WTI is in steep contango. The following chart is a 30-year histogram of monthly contango (front plus one minus front):
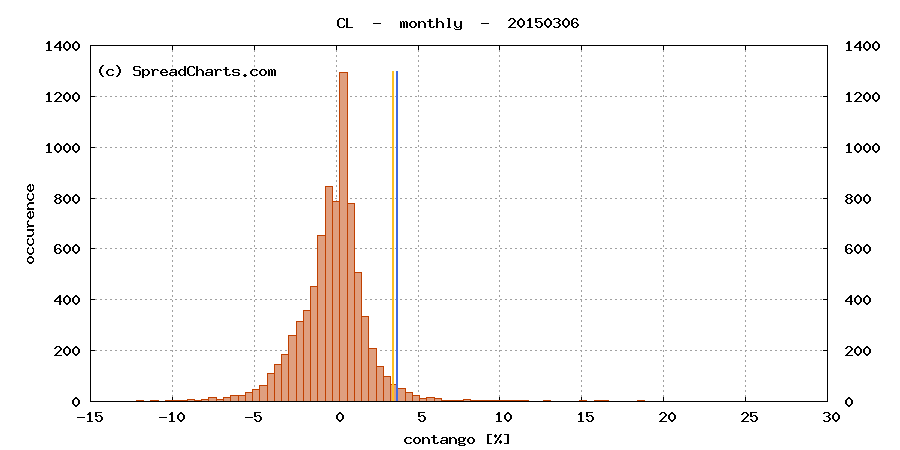
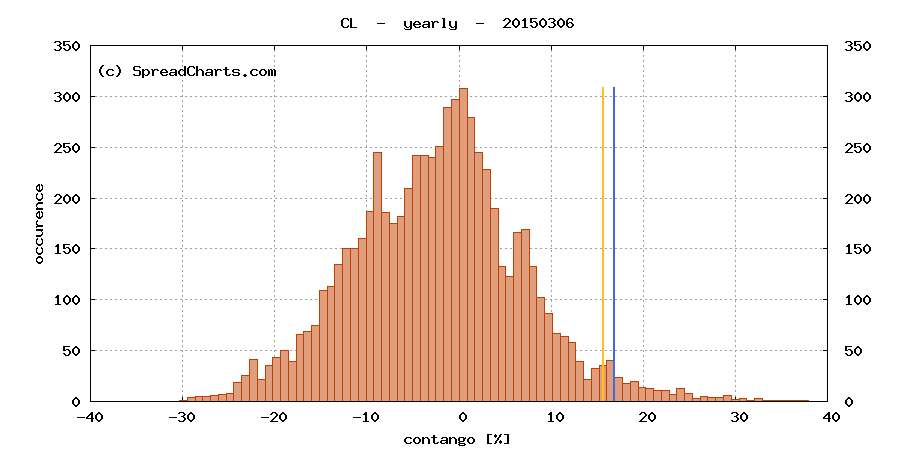
The blue vertical line highlights the current level of contango. We can definitely say the current contango is very high even from a historical perspective. But the chart also shows there’s still plenty of room for the widening. The yearly contango (front plus twelve minus front) is telling basically the same story:
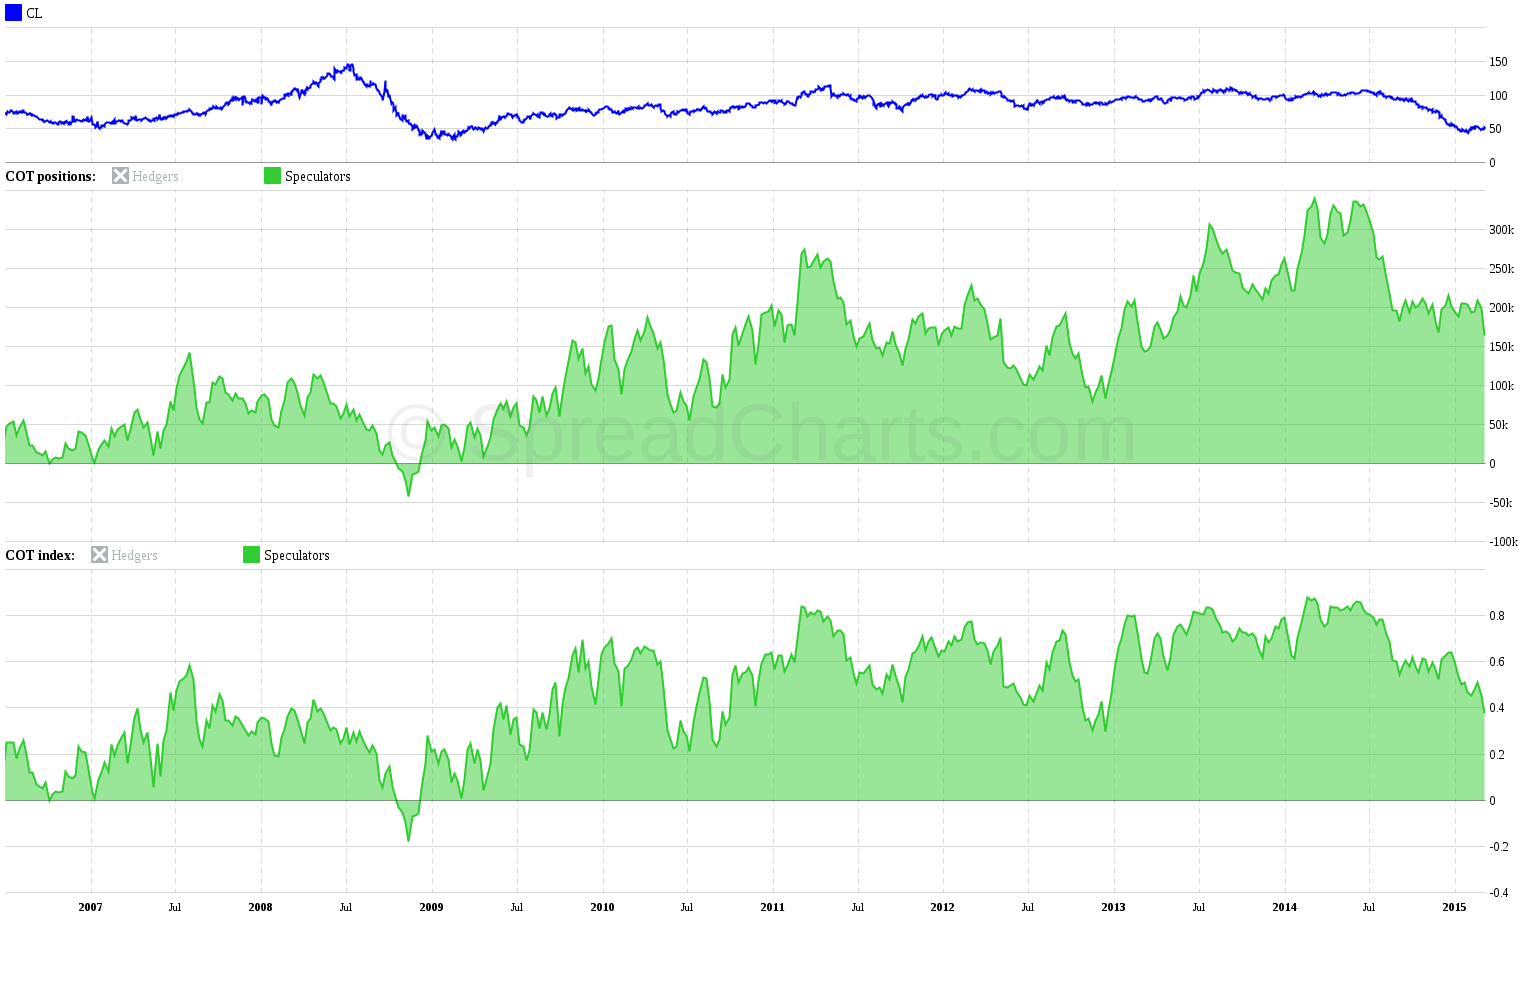
So contango is high, that’s for sure. But can the market go even lower? Let’s have a look at the Commitments of Traders. The next chart is showing managed money positions. Peaks in the COT index predicted local maxima in the price pretty well during the years. Positions have declined significantly from their last peak in summer 2014. However, there are still more than 160000 speculative net long positions. So the COT is basically saying there is still more room to the downside. During the last bear market in 2008 speculative positions even turned net short! That level is still far off.
Check out these great articles as well
New data: Rates and electricity
As promised, we’re adding new data to the SpreadCharts app. Importantly, the goal is not...
Read moreNew data: Sector indices
Our software is already established well beyond commodity market analysis. Stock indices, currencies, and even...
Read moreWhat’s new in the SpreadCharts app?
It’s been a few months since we launched the new version of the SpreadCharts app....
Read moreA major new version of the app is here
Today, we’re excited to show you the major new version of the SpreadCharts app that’s...
Read more