The power of intermarket spreads
Intermarket spreads are strategies where the legs of the spread are from two different commodities. They are usually employed by institutional traders and other professionals due to their high capital requirements. In other words, you need a large account to trade them, and they are not suitable for beginners. But that’s really their only disadvantage.
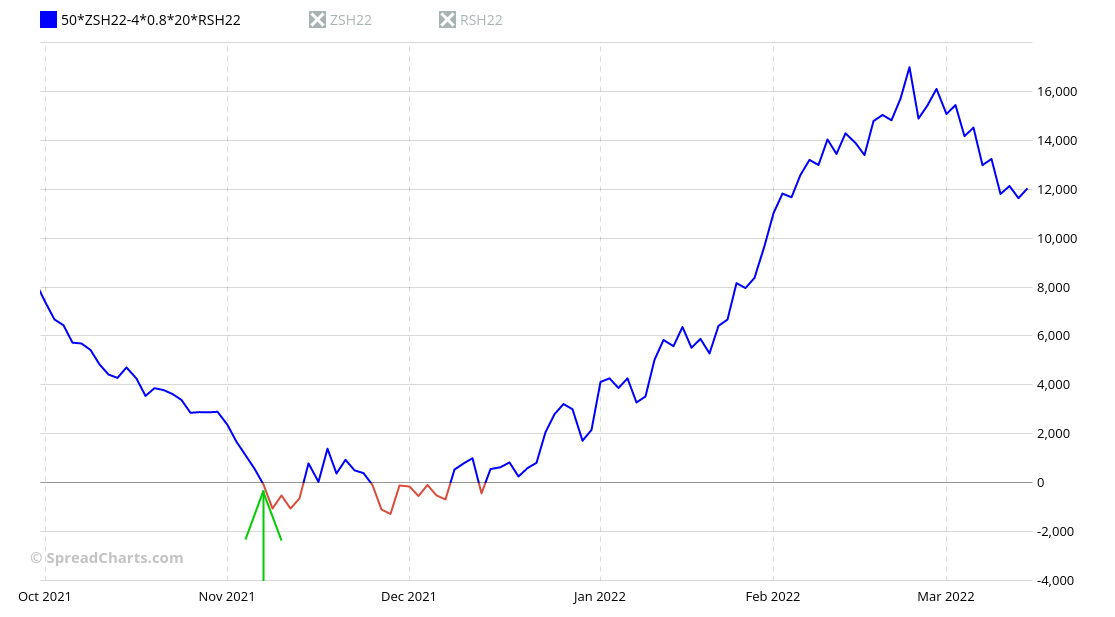
On the bright side, these strategies can deliver impressive results when the rest of the market is broken. That was the case of the spread between soybeans and canola we alerted our premium users about in November. We even call it an opportunity like never before, as the ratio reached all time low. Here is the equity chart of the spread with the highlighted date when we published the analysis to our users.
Do you see this nice uptrend with little volatility? Remember, this was during the time when the US stock market dropped by more than 10% and remained very volatile. This is the power of intermarket spreads.
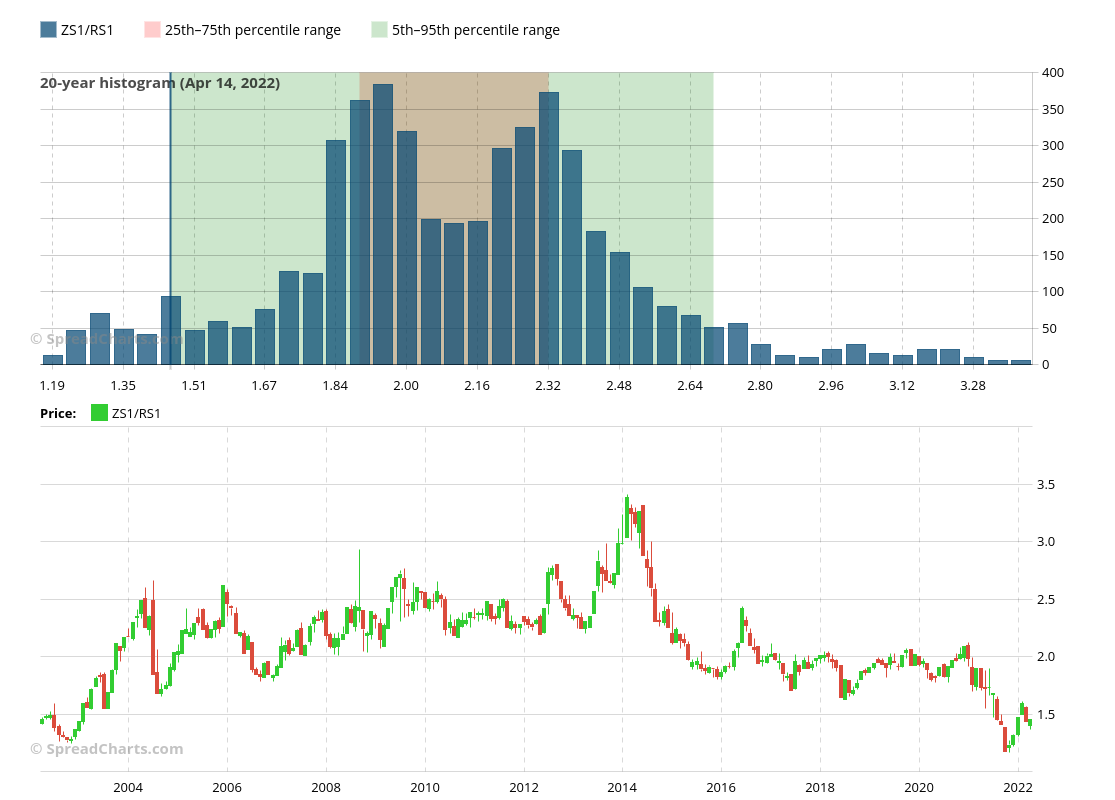
We identified this opportunity thanks to the tools in the SpreadCharts app. I can especially recommend the histogram of the ratio between two commodities. It is the fastest way to spot these incredible situations. For example, this is how the ratio between soybeans and canola looks right now.
If you want to know how we found this opportunity and the process of assembling the spread between those two commodities, you can learn it in the following video. It was originally published in November for our premium users, and we received great feedback on it from several funds who made a killing on this opportunity. Now we’re releasing the video for free.
Get the premium version of SpreadCharts if you don’t want to miss such an opportunity next time.
Check out these great articles as well
New data: Sector indices
Our software is already established well beyond commodity market analysis. Stock indices, currencies, and even...
Read moreWhat’s new in the SpreadCharts app?
It’s been a few months since we launched the new version of the SpreadCharts app....
Read moreA major new version of the app is here
Today, we’re excited to show you the major new version of the SpreadCharts app that’s...
Read moreLiberation Day!
Tariffs are arguably the dumbest part of Trump’s agenda. Yes, the goal makes perfect sense,...
Read more
