US Dollar up?
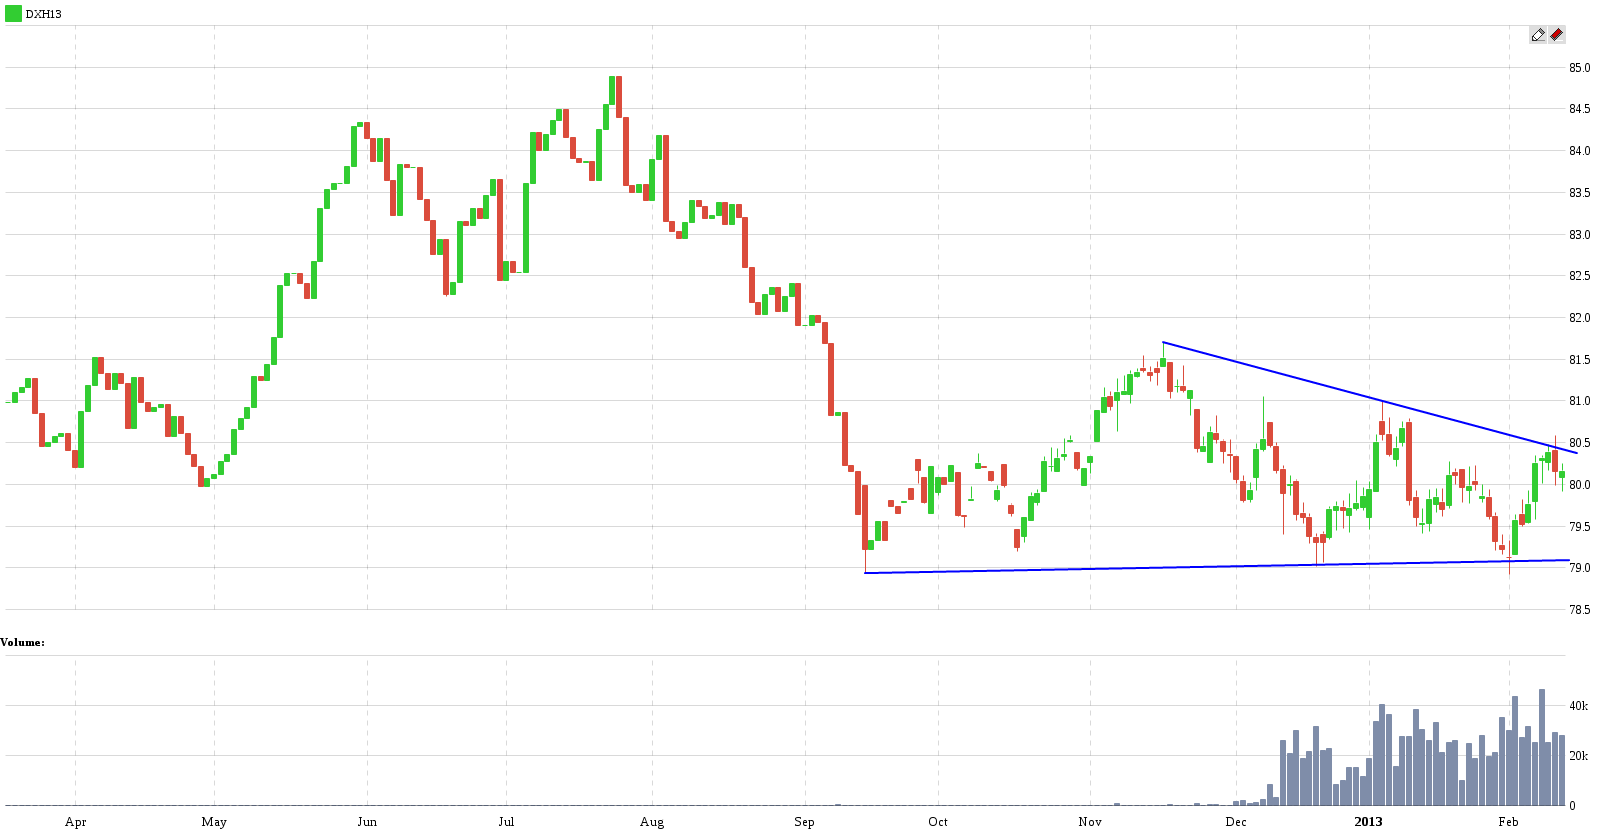
The US Dollar is on the verge of breaking up. At least in my opinion. And I think the upcoming move will be a big one. Gold and silver will probably get crushed. As you can see in the March Dollar index (DXH13) future daily chart the dollar is completing a bullish wedge pattern:
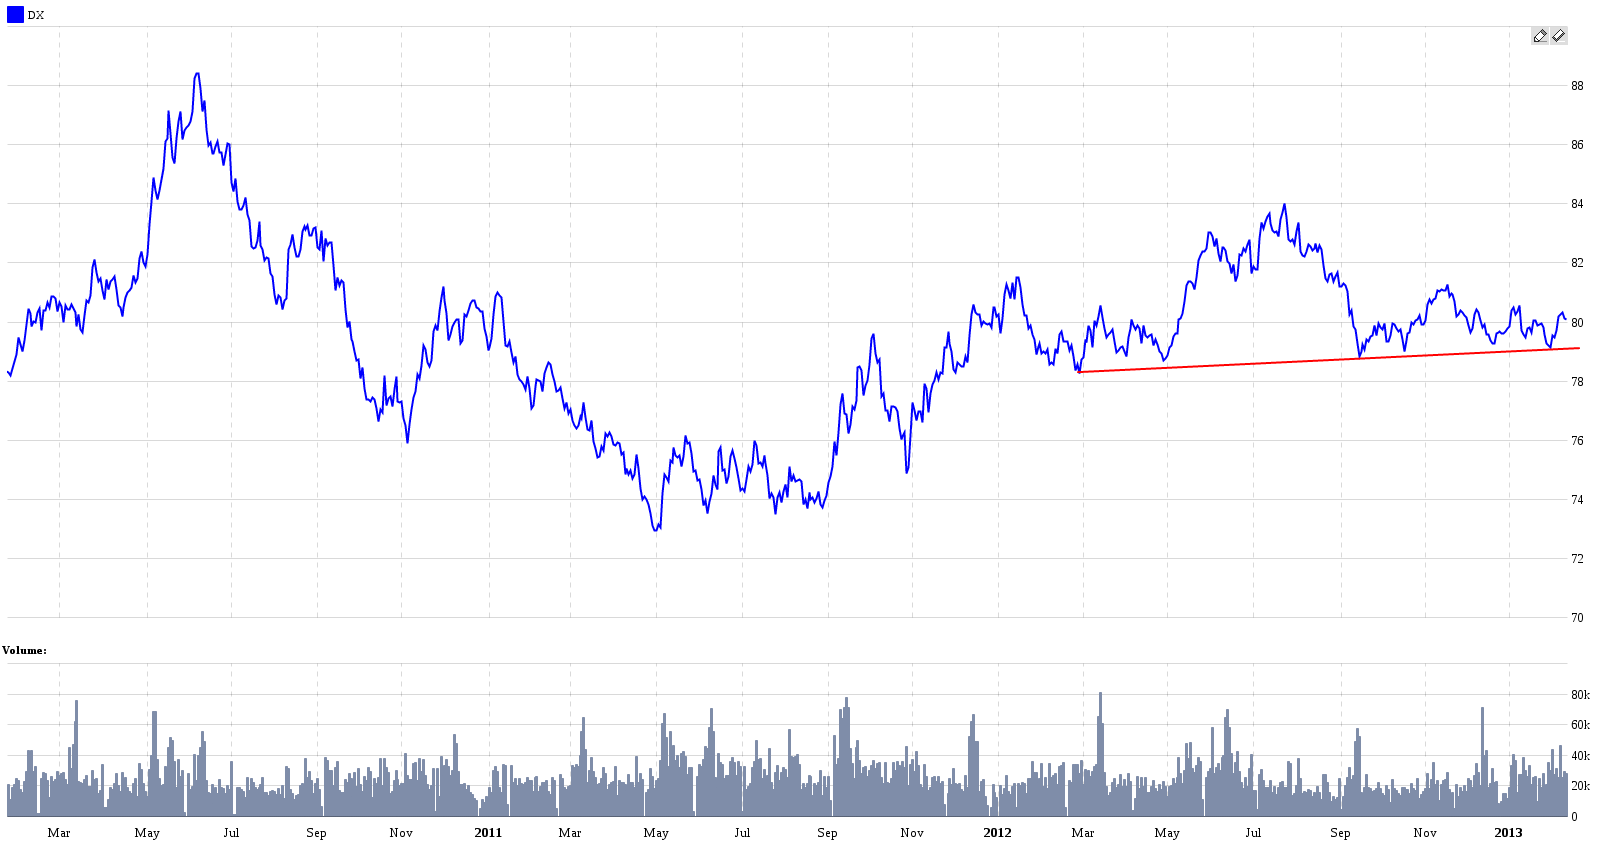
Maybe the dollar won’t make the breakout immediately but I think eventually it will. Here is the DX continuous chart showing a major support line:
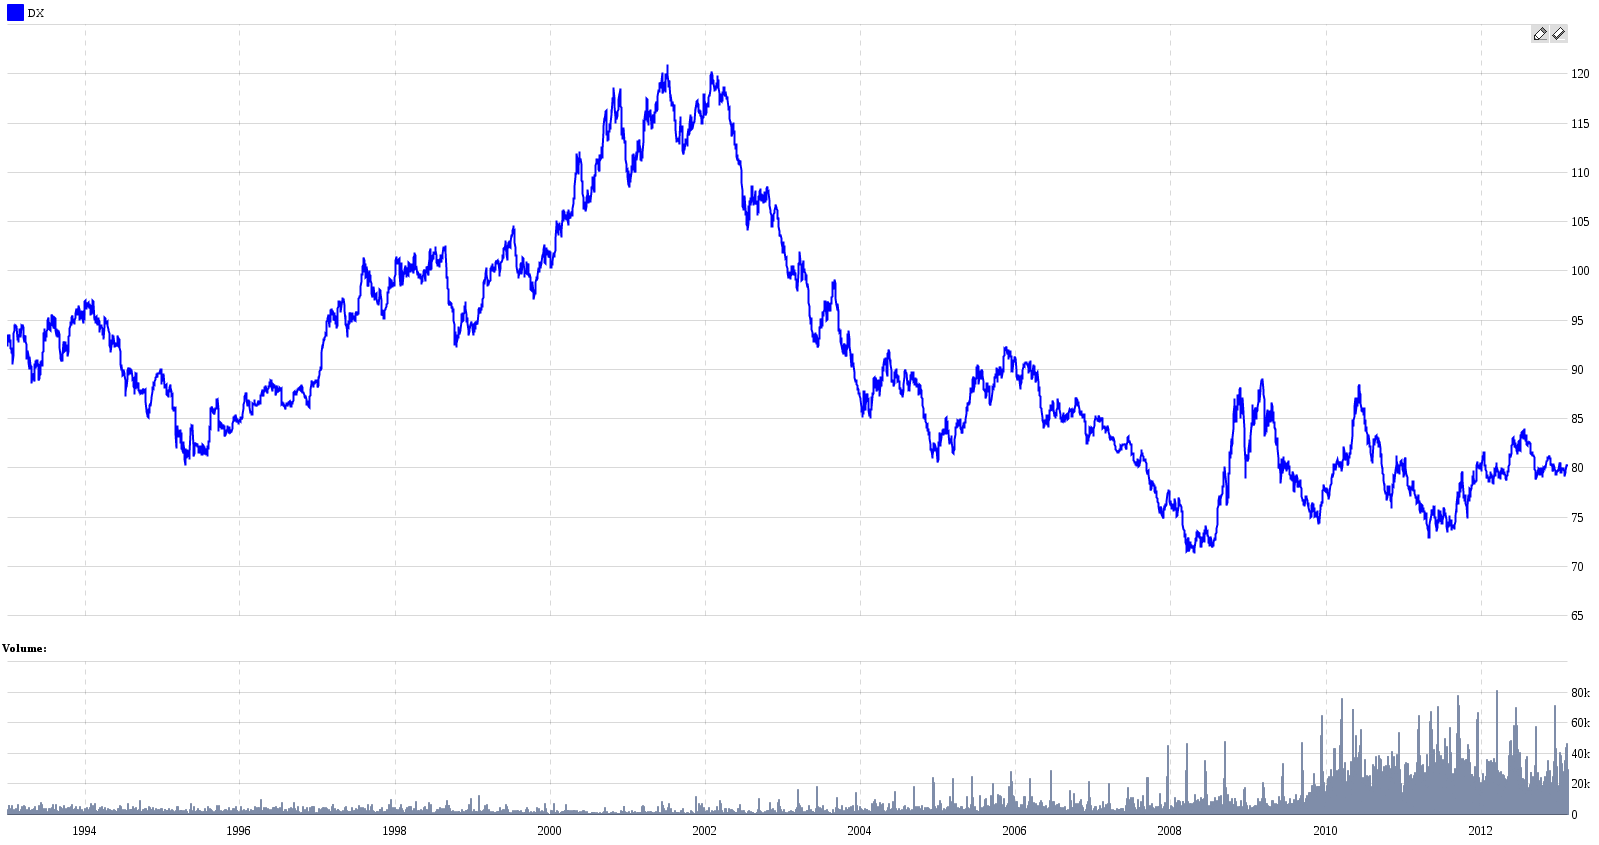
Well, nothing is sure in the end. You can interpret the chart above also as head and shoulders pattern. It’s possible. But I think most likely we will see an uptrend in the dollar. Next, comes the long-term continuous DX chart:
I think (and it’s purely a guess) the dollar index can get to somewhere below 90…maybe 87 – 88. This would mark the last dip in gold and silver prices after which the next major up leg in precious metals will take place. It will be fueled by inflation propagating into the economy from the Fed’s monetization actions in the last few years. At least if I’m not wrong. We’ll see.
Check out these great articles as well
New data: Sector indices
Our software is already established well beyond commodity market analysis. Stock indices, currencies, and even...
Read moreWhat’s new in the SpreadCharts app?
It’s been a few months since we launched the new version of the SpreadCharts app....
Read moreA major new version of the app is here
Today, we’re excited to show you the major new version of the SpreadCharts app that’s...
Read moreLiberation Day!
Tariffs are arguably the dumbest part of Trump’s agenda. Yes, the goal makes perfect sense,...
Read more

