Where is gold heading in 2015
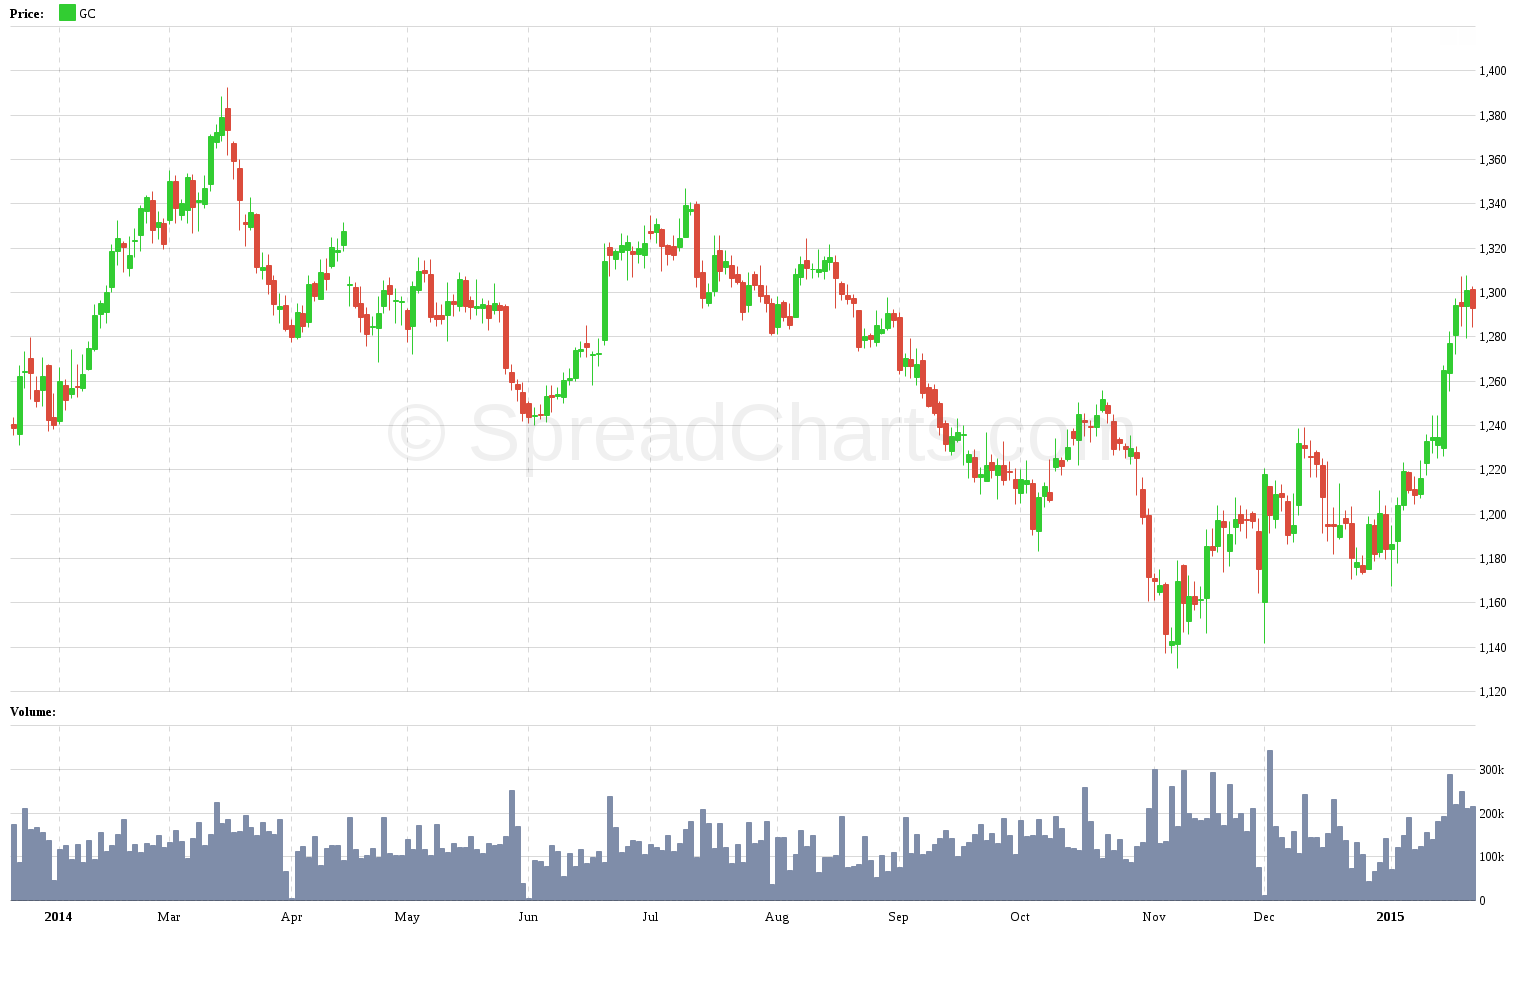
Gold has been experiencing a strong rally since the start of 2015. The price currently hovers slightly below $1300.
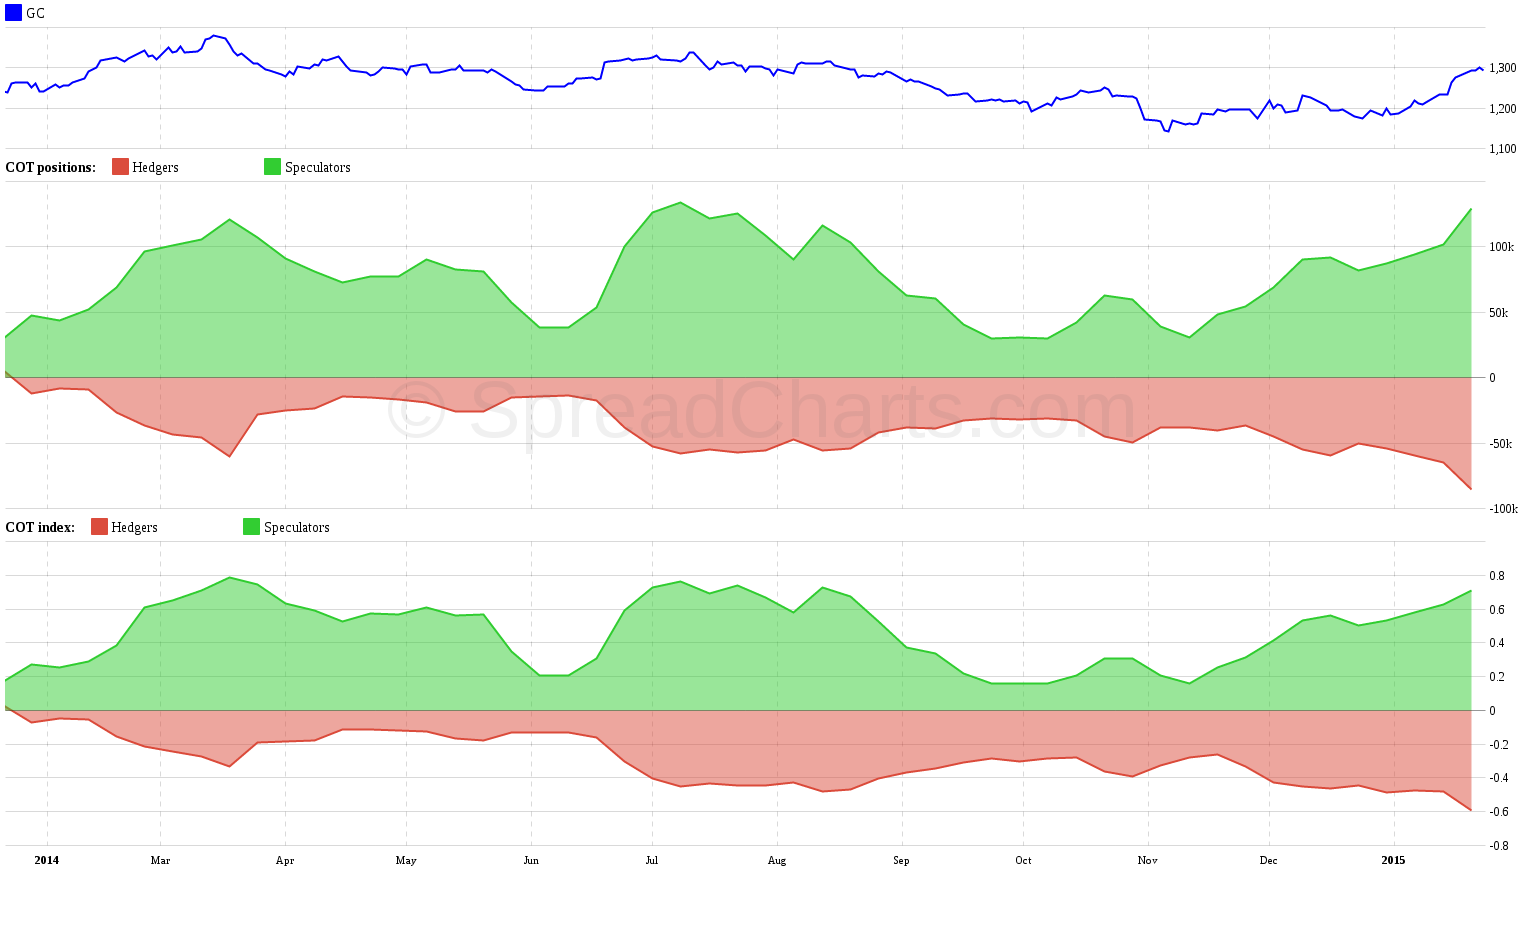
So what’s next for the gold price and what can we expect in the longer term? The most important thing I’d like to highlight is how the current move has impacted the positions structure of the gold futures market. Let’s take a look at the Commitments of Traders:
As you can see in the chart above, the latest move has pushed positions to extreme levels from the short-term perspective. When you look at the COT index, speculative positions (managed money) are approaching the 0.8 level, which marked the turning point of the price to the downside during last year. Hedgers positions (producers, mercs, processors) measured by COT index have already crossed into the most extreme level since the start of 2013. This is definitely a strong bearish signal.
Does that mean the price should start falling next week? Probably not! The market has its dynamic and COT is not a short term indicator. Even though COT positions are near extreme levels, it usually takes some time to turn the market with such a strong momentum. The uptrend can last a few more weeks until the price tops.
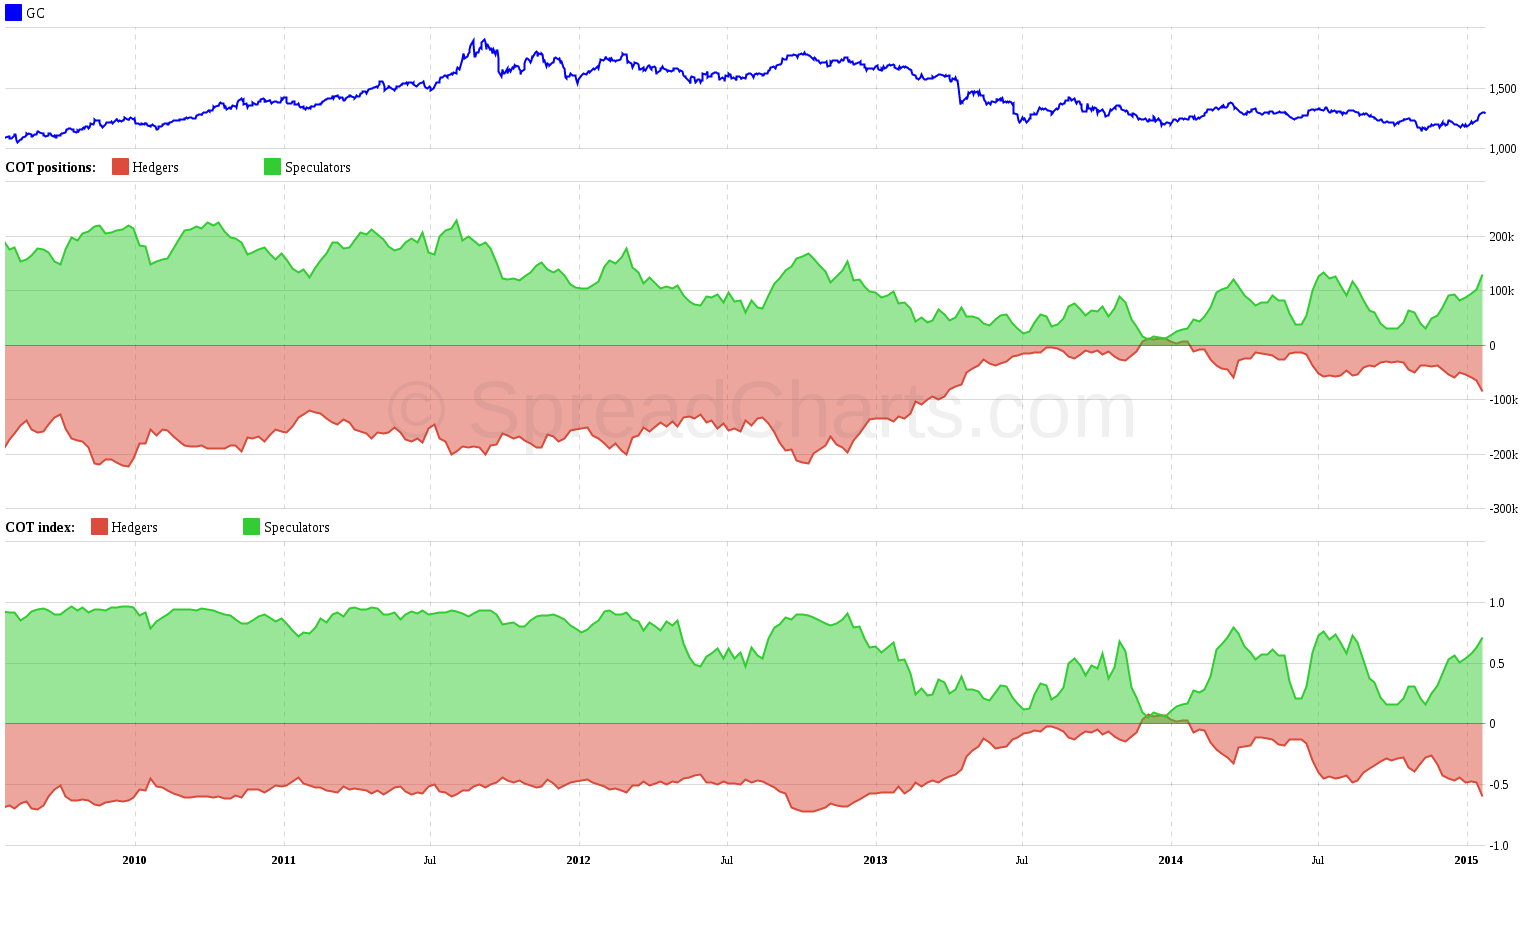
All of this stays true if we assume that gold will stay in a bear market. But will it? When we look at the longer term COT (5 years), we would see that in the bull market till 2013, COT index remained at extreme levels for years and positions were fluctuating only slightly:
What if we are witnessing a fundamental change of the trend…a birth of a new bull market in gold? What if COT index won’t come back from the extreme levels? Well, that’s impossible to predict. It’s always better to trade what you see and not what you think. And what I see? I see the $1400 level to be a critical juncture. Until the price breaks through this level and stays above it, we can’t declare gold to be in a bull market. This is the fact you should take from this article.
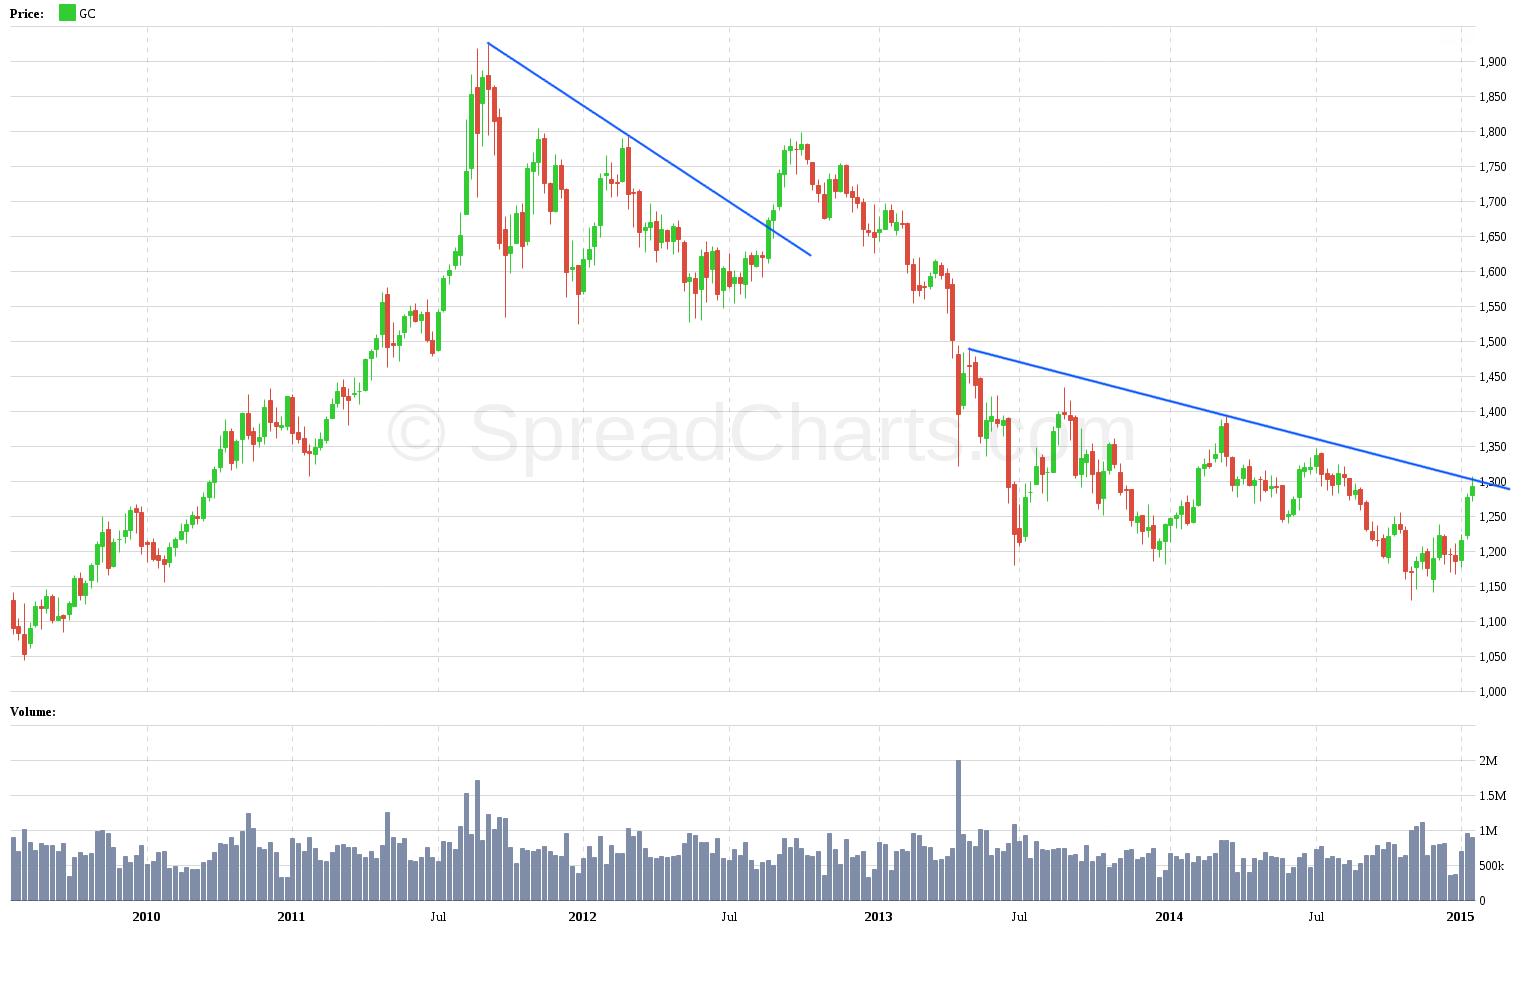
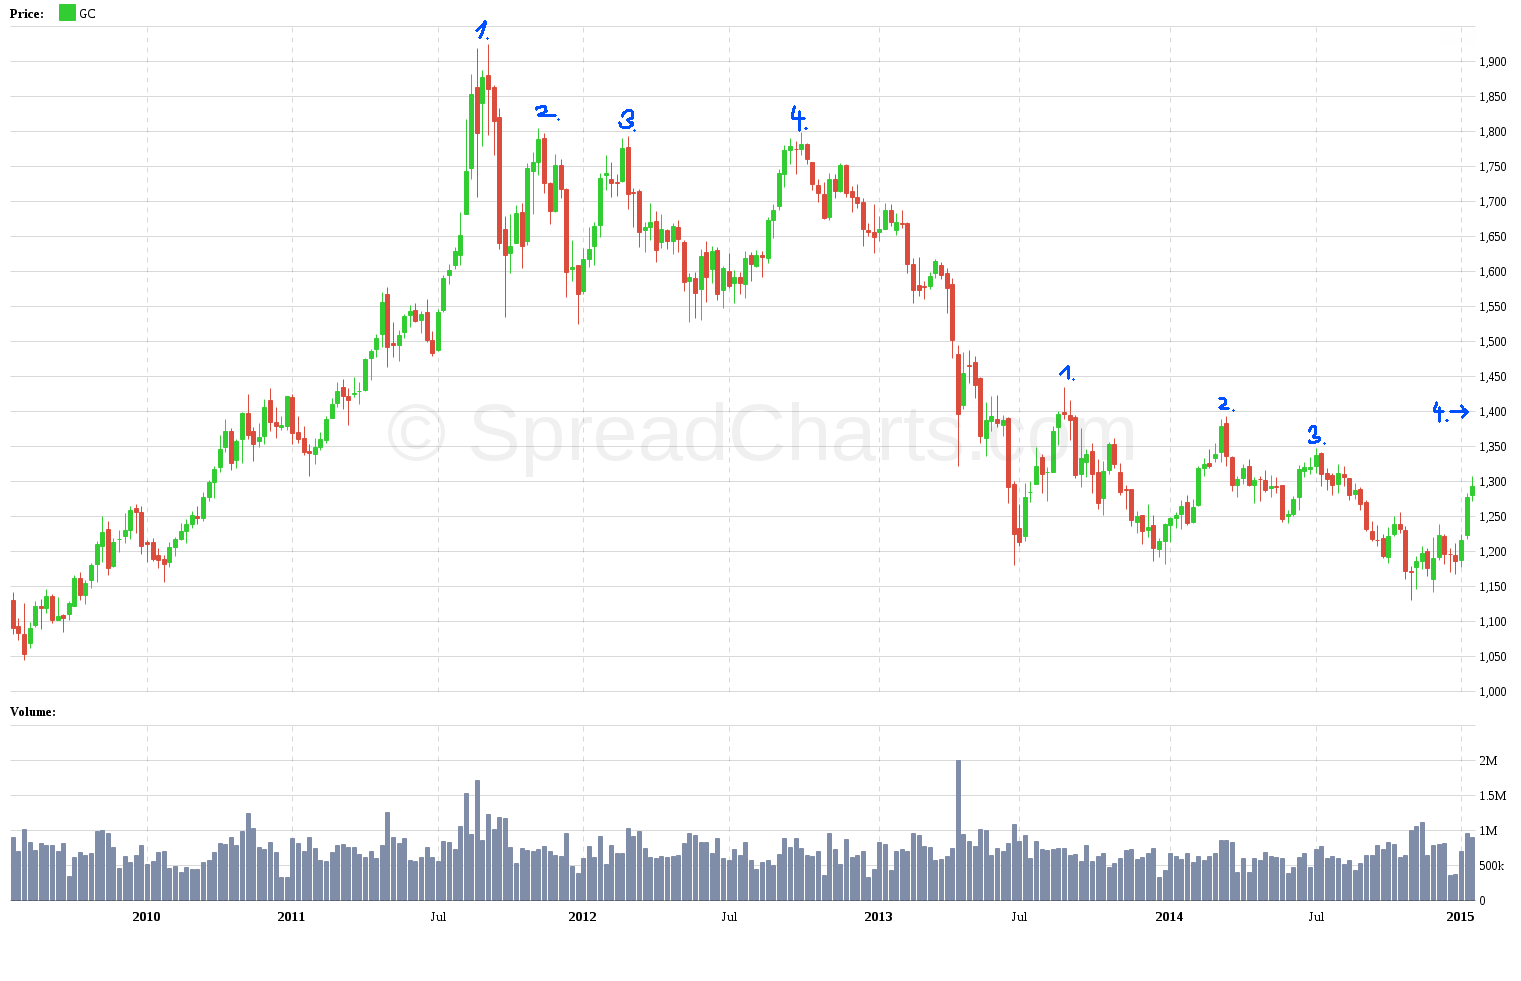
And now some speculation. What I personally think is the most probable scenario? I usually stick with facts…and the fact is gold has been in a bear market since the summer of 2011. When the price establishes a trend, it’s always more probable that the price will move in the direction of that trend, rather than against it. So until the $1400 level is broken, I would expect the price to move lower. Other than that, I haven’t seen a capitulation yet like I saw in 2008. In that year, even most of the hardline gold bugs eventually capitulated. Nothing like this happened yet. When I look at the weekly chart I see many similarities with previous trading ranges in 2011 – 2013:
Gold is at resistance highlighted by the blue trendline. I think the price will break through like it did in 2012. Everybody will then celebrate a new bull market in gold and people will start to talk about how long it will take gold to go back to $2000. After sucking everybody into longs, the market will turn down and blow through previous lows. What will be the turning point? I suspect the $1400 price mark to be the best candidate given the similarity to the previous trading range:
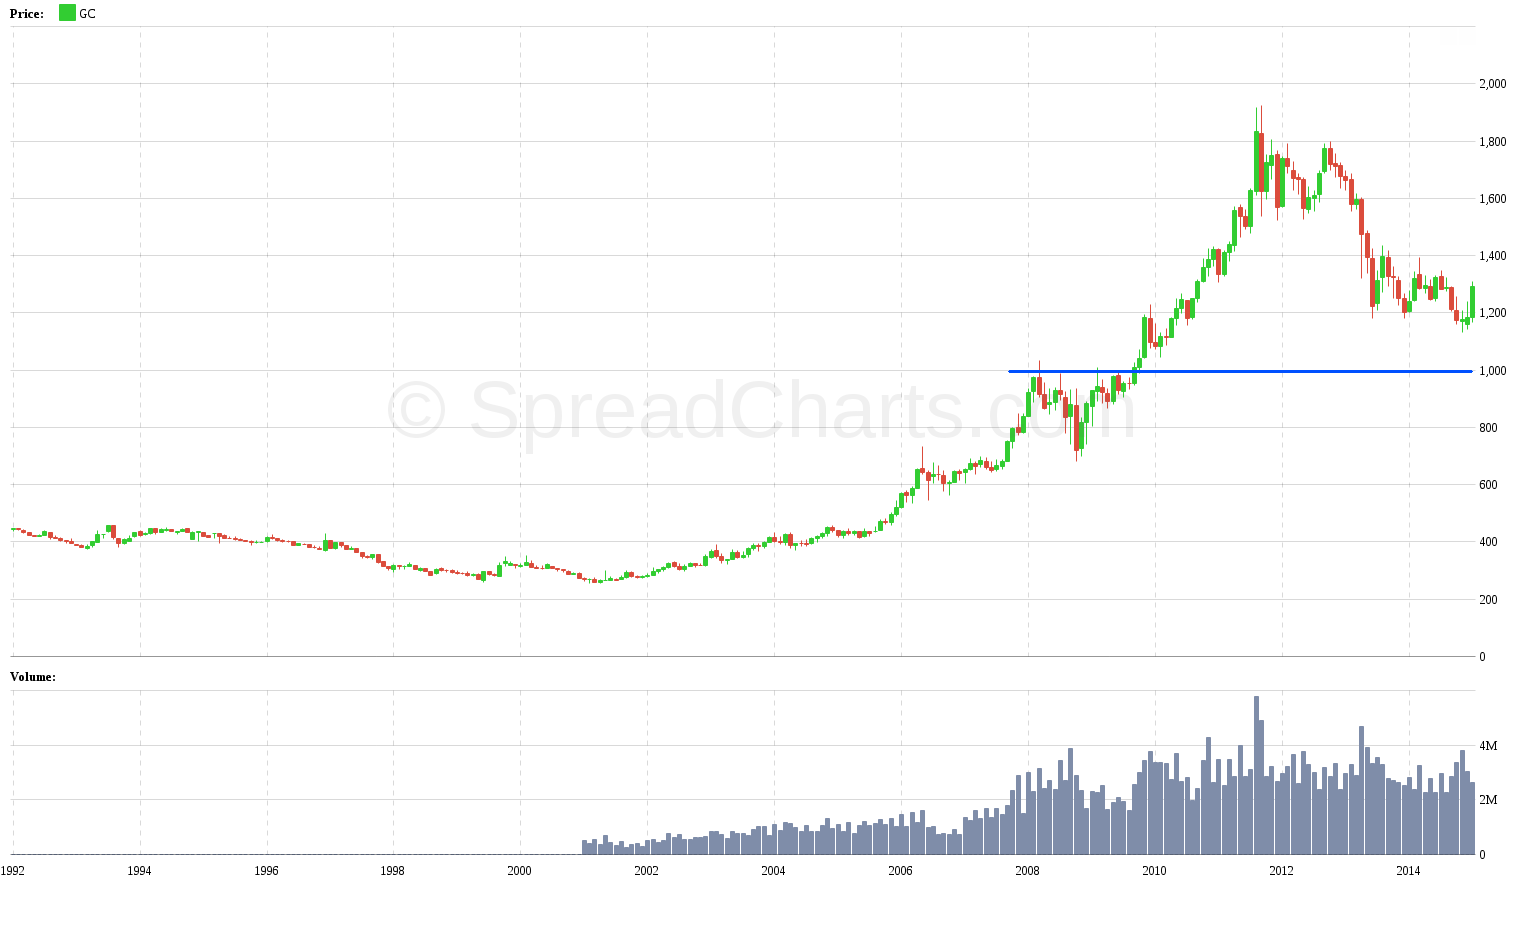
If the bear market will prevail, how low can gold prices go? This is purely a guess, but I think the $1000 level would be a strong magnet. Below that is uncharted territory. But remember it’s never possible to time the exact tops and bottoms. Even if gold would fall as low as $600, it would still be in long term bull market. The one that started in 2001. And despite being a medium term bear, I’m bullish on gold and especially silver in the long term.
Check out these great articles as well
New data: Sector indices
Our software is already established well beyond commodity market analysis. Stock indices, currencies, and even...
Read moreWhat’s new in the SpreadCharts app?
It’s been a few months since we launched the new version of the SpreadCharts app....
Read moreA major new version of the app is here
Today, we’re excited to show you the major new version of the SpreadCharts app that’s...
Read moreLiberation Day!
Tariffs are arguably the dumbest part of Trump’s agenda. Yes, the goal makes perfect sense,...
Read more