Massive rally on grains
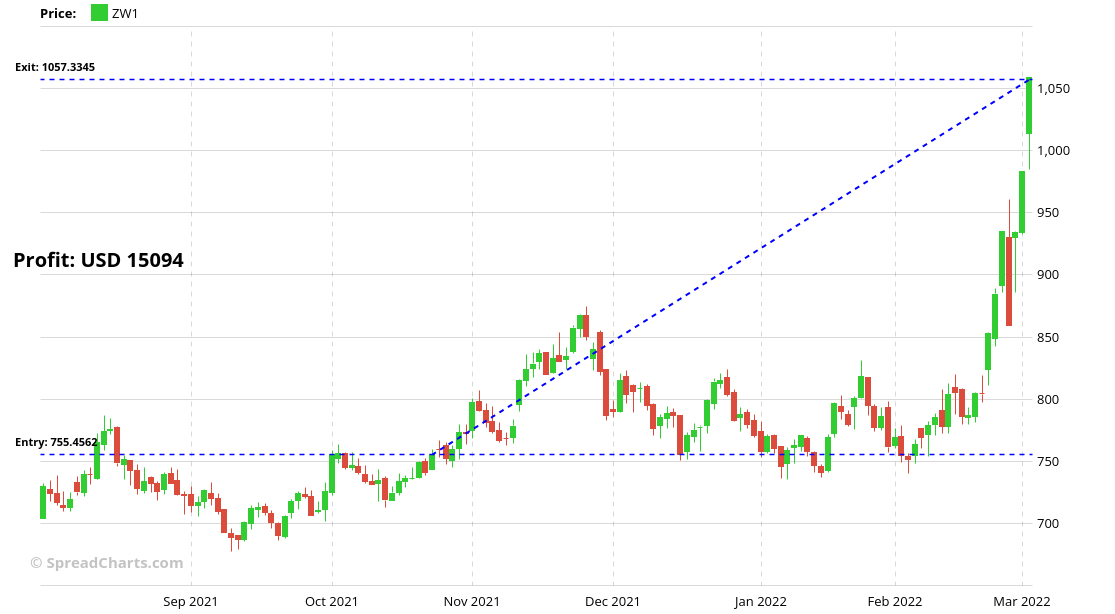
Are you surprised by the massive rally in grains? Well, you should not be, as that’s precisely what we foresaw in October last year.
(1/7) We think there is a decent likelihood of a massive rally on grains!
Especially #wheat looks strong, but #corn and #soybeans would benefit too.#OATT #ZC_F $CORN #ZS_F $SOYB #ZW_F $WEAT $DBA pic.twitter.com/rjGRT0tld2
— SpreadCharts.com (@SpreadChartsCom) October 24, 2021
We even correctly identified wheat as the most promising grain out of the major crops.
(6/7) Turning to #wheat, the price action is very simple. The market is consolidating, making higher lows and dissipating the previously optimistic sentiment.
Once the resistance breaks, see you at $10.#OATT #ZW_F $WEAT $DBA pic.twitter.com/5OYbZ7ssQY
— SpreadCharts.com (@SpreadChartsCom) October 24, 2021
Our initial price target at $10, unbelievable at the time, was just hit yesterday.
The question is how bad the situation is right now. I’ll focus on wheat that was hit the hardest by the war in Ukraine.
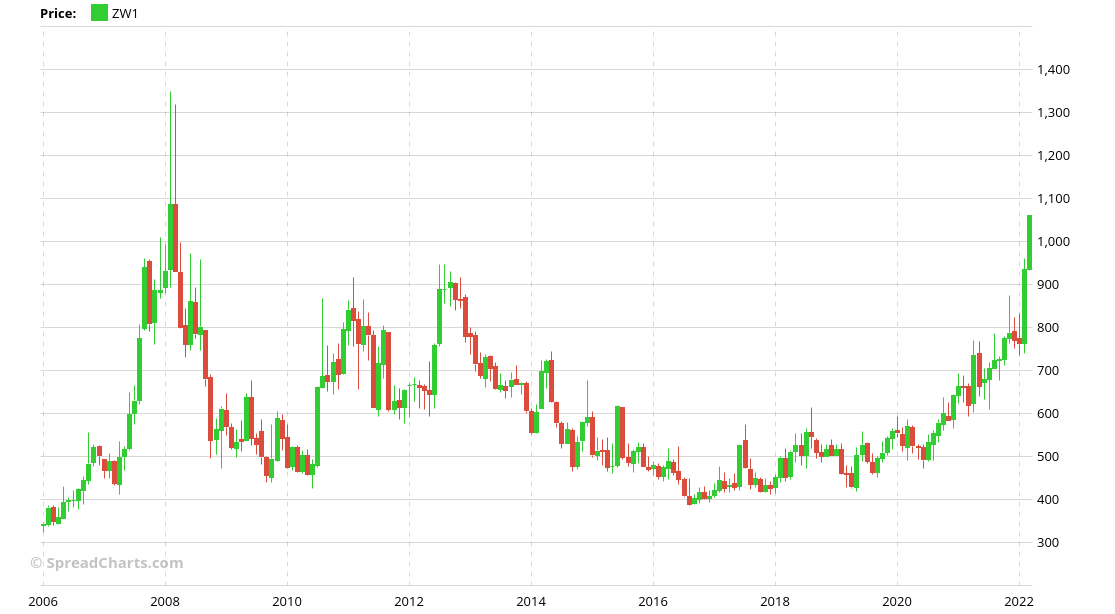
Despite the unprecedented supply shock, the CBOT wheat remains below all-time high from 2008 at around $13.50.
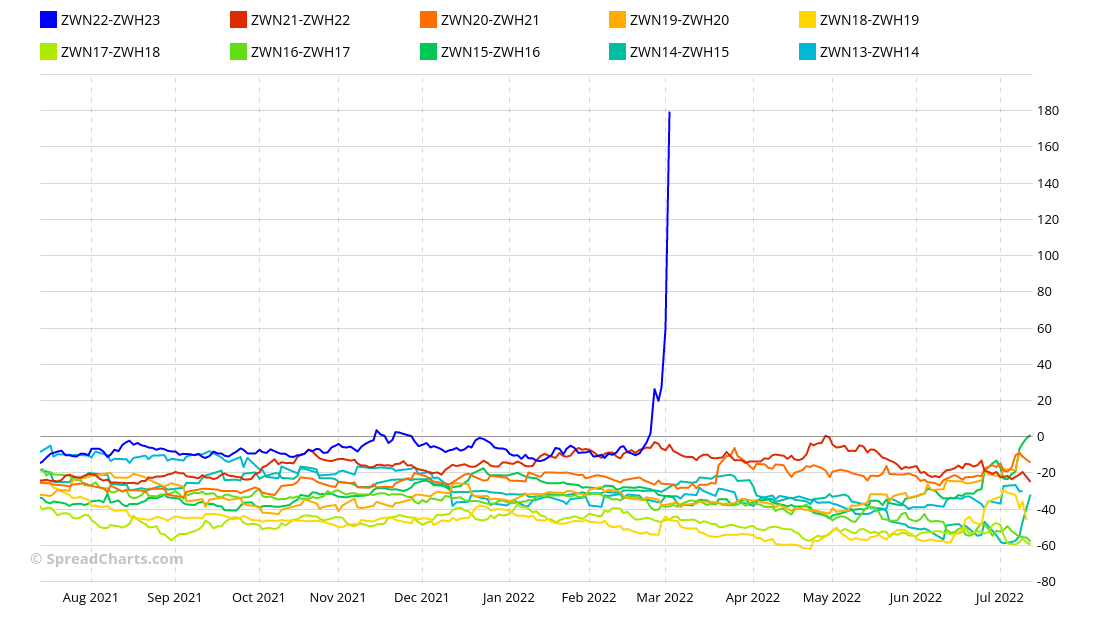
But if we look deeper into the data, we may find some disturbing facts. Structurally, the market is at such an extreme we have never witnessed. For example, let’s look at the stacked seasonality chart of the ZWN22-ZWH23 bull spread. It settled at 179.50c yesterday. Normally, this spread basically never trades above zero!
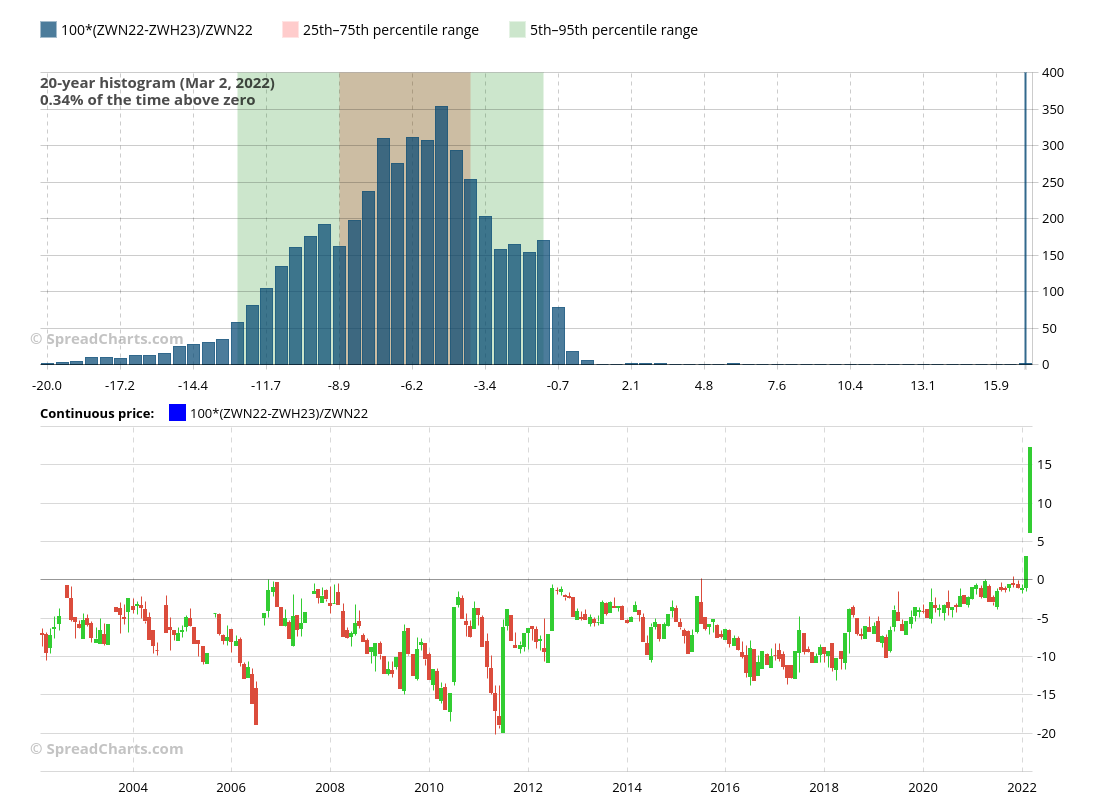
But let’s do a more statistically rigorous study. Here’s the same spread expressed in contango percentage, which should better reflect the state of the market than the spread itself and way better than just the price of the underlying commodity. The backwardation on this part of the term structure curve currently stands at 17%. This metric has never exceeded 1% over the past 20 years if we do not count the past week. It’s a multi-sigma move no model could have forecasted.
It seems I’m a bit overusing the word “never”, but you should get used to it in these markets. Maybe you wonder what comes next. Is this the top? Or is the crazy move about to continue. Frankly, we don’t know, and you should not try to pick the top. This market is unpredictable because it is so far away from anything we’ve seen in the past. The extreme volatility makes it impossible to trade for any system with sane risk management. And there is no way to get around it, as the option premiums are through the roof too.
In any case, here are the things we will be watching:
- any sign of at least a temporary ceasefire between Russia and Ukraine or, on the other hand, further escalation (attack on Odesa and potential invasion of Moldova)
- while Ukraine plants barely any spring wheat, the winter wheat harvest should start in July, which is threatened by the war
- Ukraine is also an important corn producer, and the planting that usually takes place in April and May may not happen at all
- blockade of Ukrainian seaports and recent attacks on dry bulk carries
- the signs of pressure from China (the only country with some leverage on Russia) that needs to import huge amounts of grains to feed its population
Check out these great articles as well
New data: Sector indices
Our software is already established well beyond commodity market analysis. Stock indices, currencies, and even...
Read moreWhat’s new in the SpreadCharts app?
It’s been a few months since we launched the new version of the SpreadCharts app....
Read moreA major new version of the app is here
Today, we’re excited to show you the major new version of the SpreadCharts app that’s...
Read moreLiberation Day!
Tariffs are arguably the dumbest part of Trump’s agenda. Yes, the goal makes perfect sense,...
Read more


