One of my favorite natural gas trades
Time has come to enter one of my favorite spread trades. It’s in NYMEX natural gas – NGQ13-NGM13. I’ve made money on this spread every single year during last five years. I consider NG to be a great commodity for spread trading. This spread trade is also very conservative because you can set just a small stop-loss. Therefore, even people without a huge account can trade it. That doesn’t mean you shouldn’t be careful. Just remember Amaranth Advisors hedge fund. It was one of the largest hedge fund collapses in history, losing more than $5 billion in total. And what was Amaranth doing? Yes, they were trading natural gas spreads like this one. CFTC later charged them with natural gas market manipulation and the impact of their collapse will be clearly visible even in our charts.
But let us take a look at our spread:
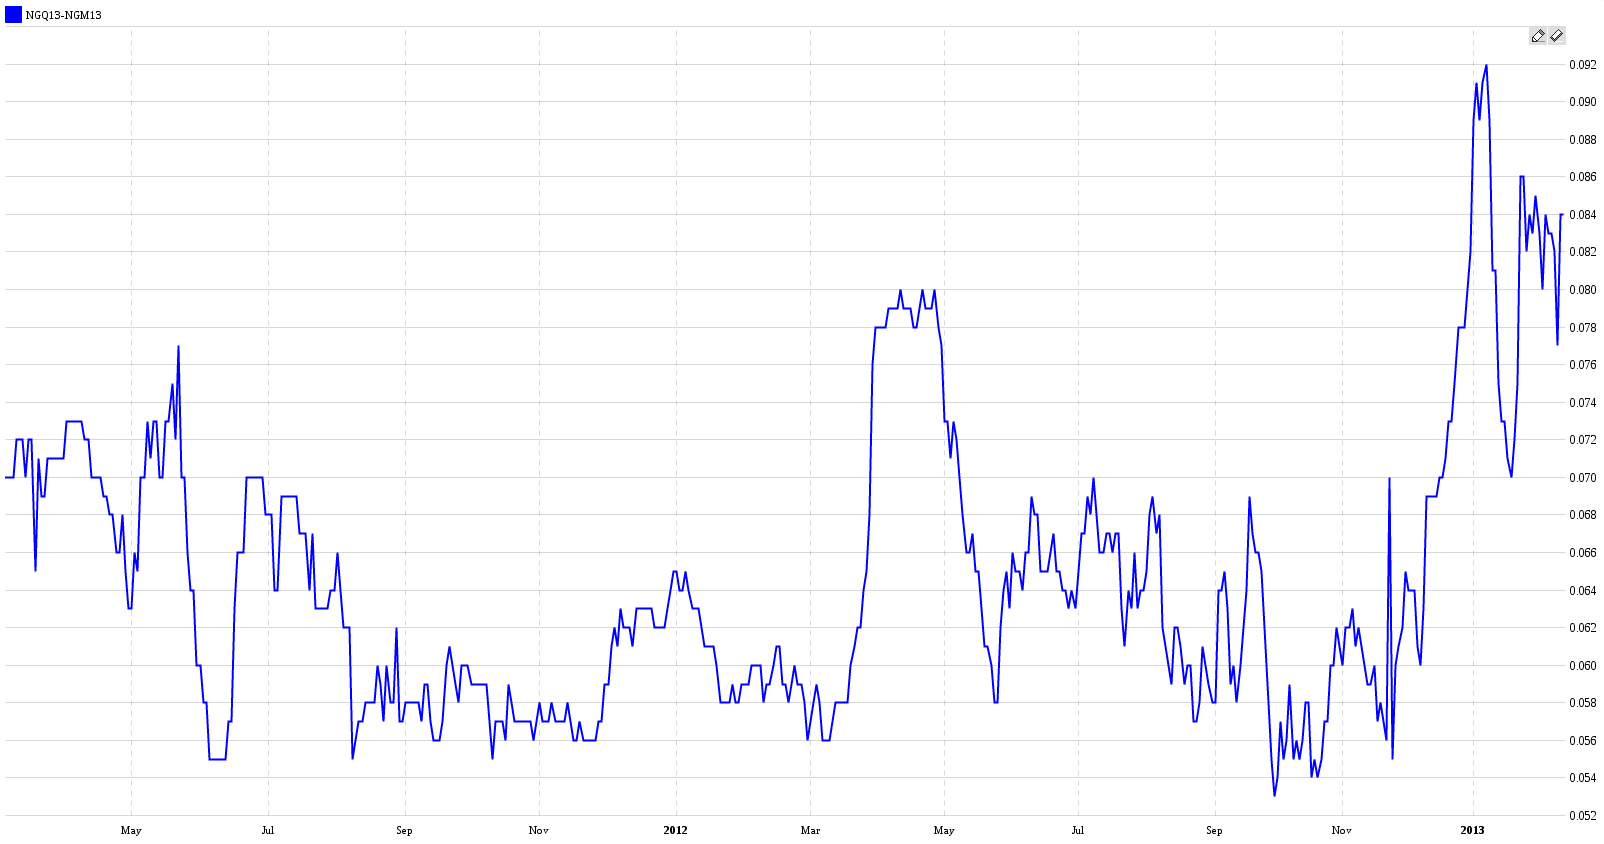
It has started to move up. It can decline back to 0.06 but the current price is still good. Now the seasonality study from our app:
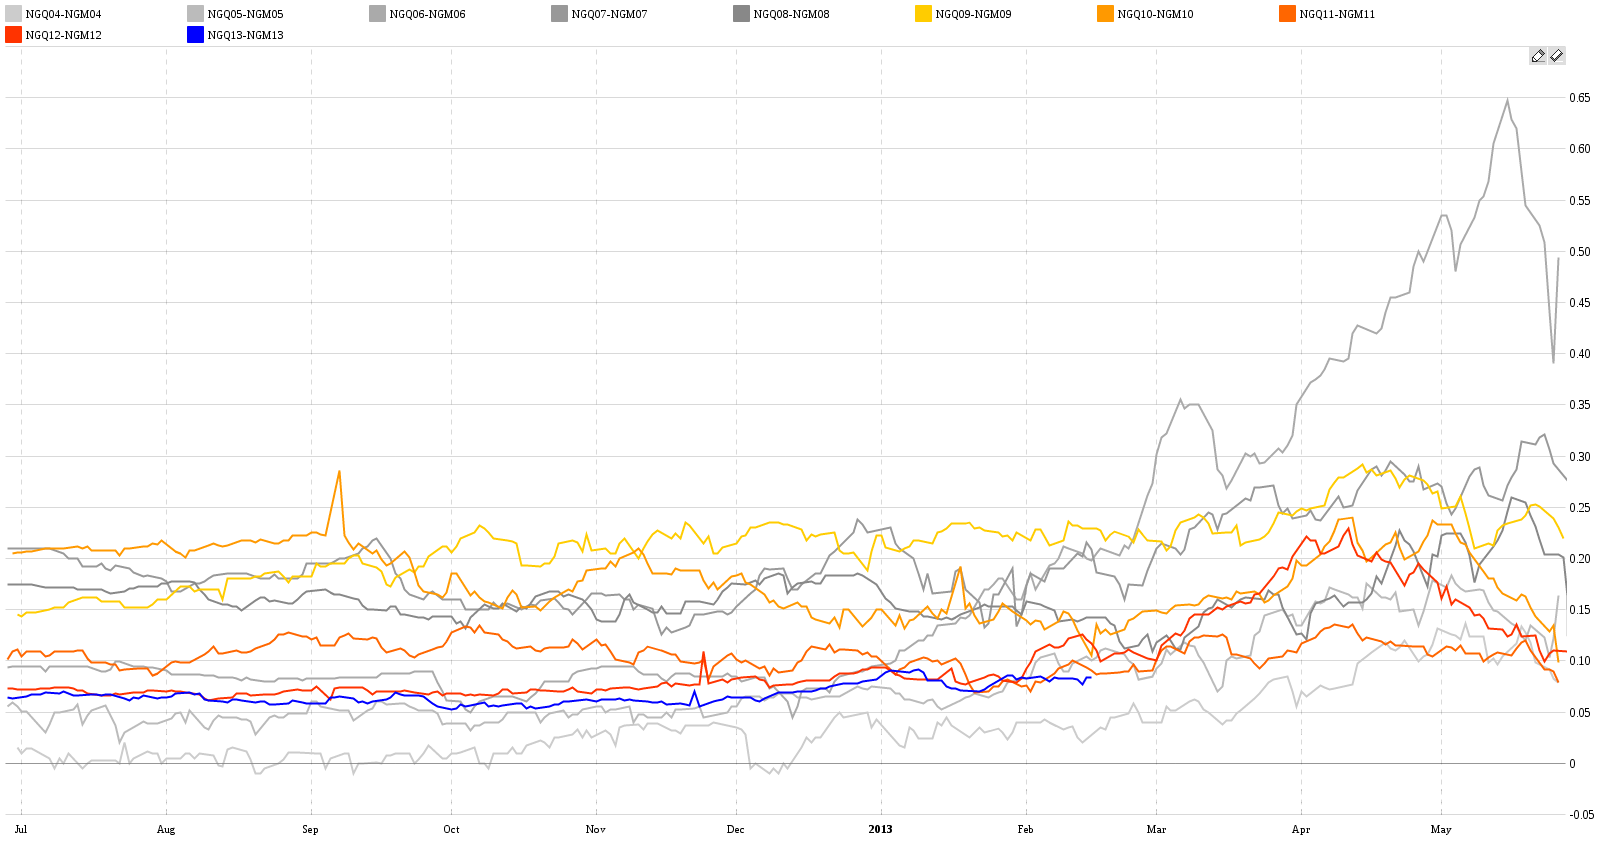
The seasonal uptrend shall start to have an effect right now. And by the way, why this spread? What’s the fundamental idea behind it? Well, it’s simple. In summer it is quite hot in the US and people tend to have air conditioners in their homes, offices, and factories constantly switched on. This consumes huge amounts of electricity. And this electricity comes from natural gas power plants because they can be easily turned on for the summer season (much more easily compared to nuclear power plants). So the idea is that demand for the August contract (deliverable at the end of July) will be much greater than demand for the June contract (deliverable at the end of May) because statistically saying it’s hotter in July and August than it is in May and June.
The seasonality chart above shows a clear seasonal uptrend. But there is one abnormal year in it – 2006. Well yes, that’s the year of Amaranth’s collapse (that happened in September 2006). Luckily in our charts we can easily hide this particular year by clicking on it in the legend. After doing so we can see a nice seasonal channel:
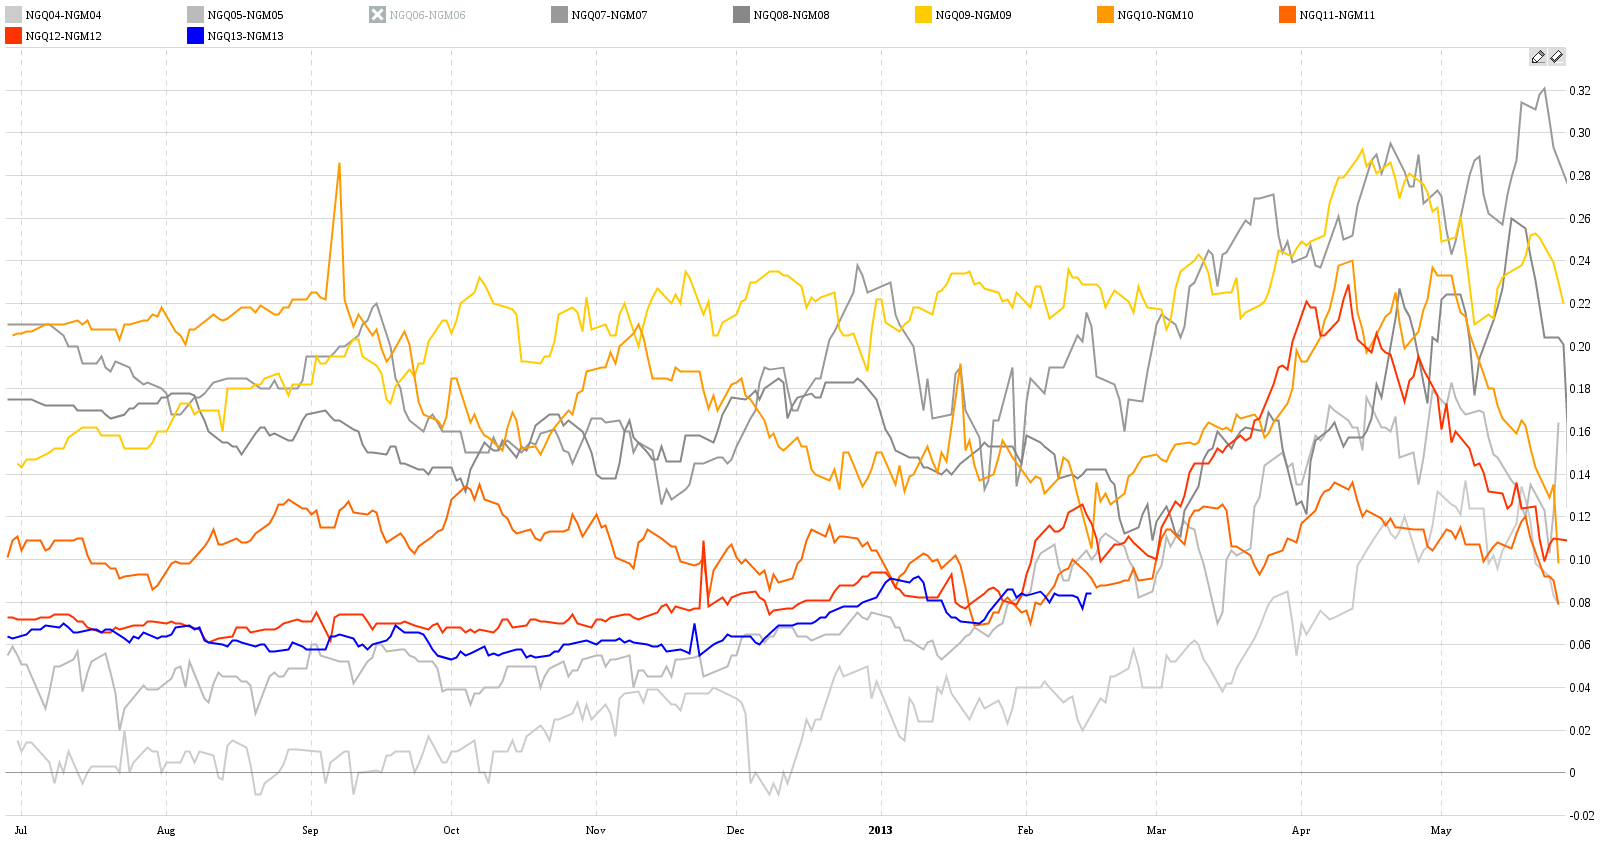
And this year price happens to be near the bottom of the channel meaning there is a lot of space to go up. Now let’s talk about liquidity. Natural Gas spreads are very liquid and have very tight bid/ask spreads. This is the reason many people like them to trade. It’s also the case with this spread:
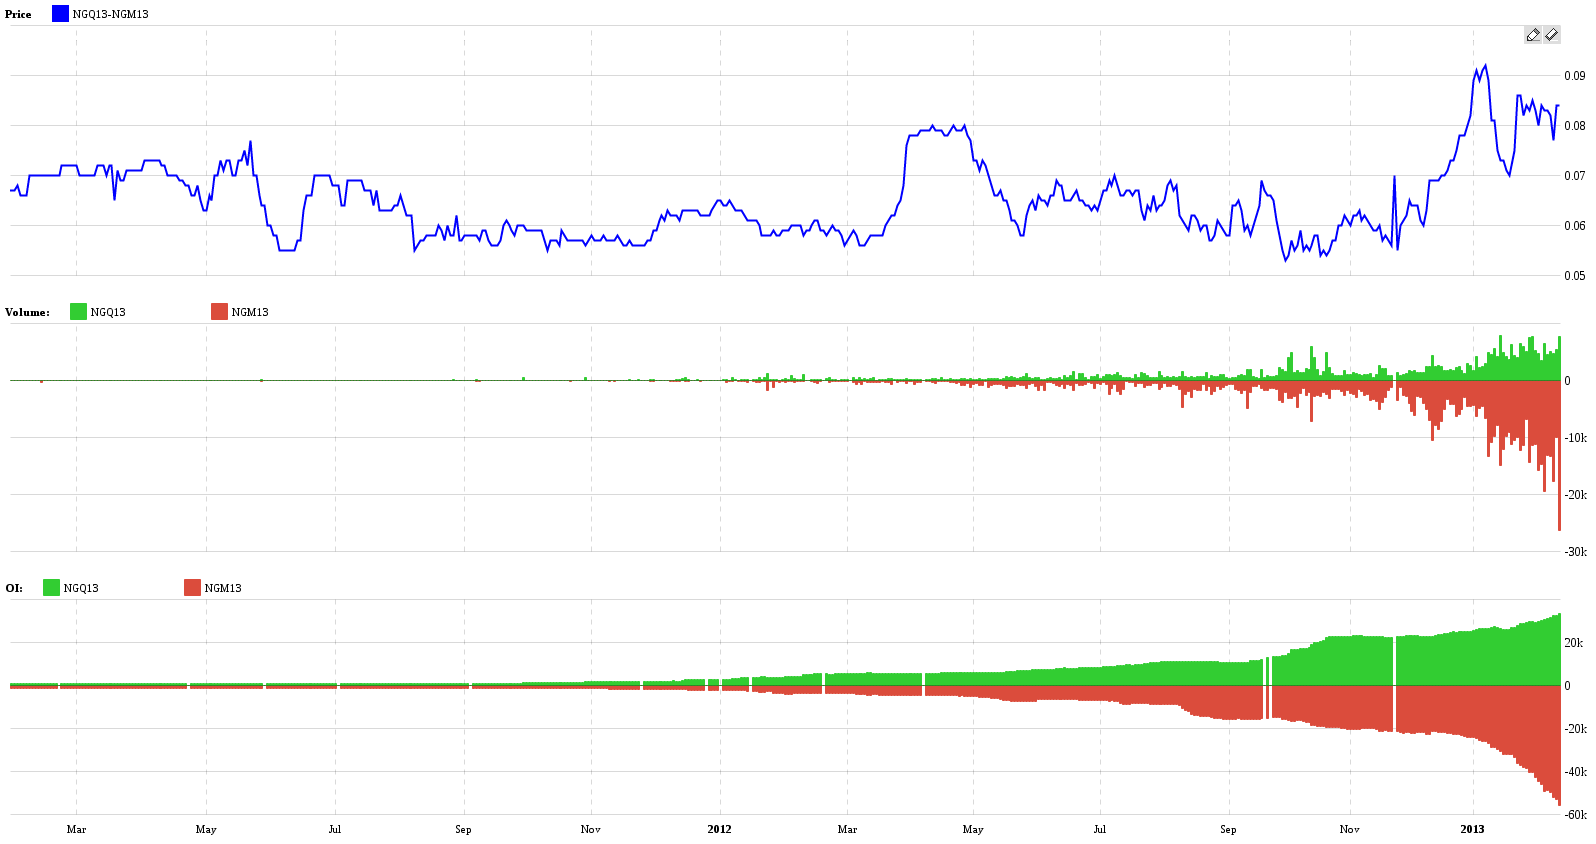
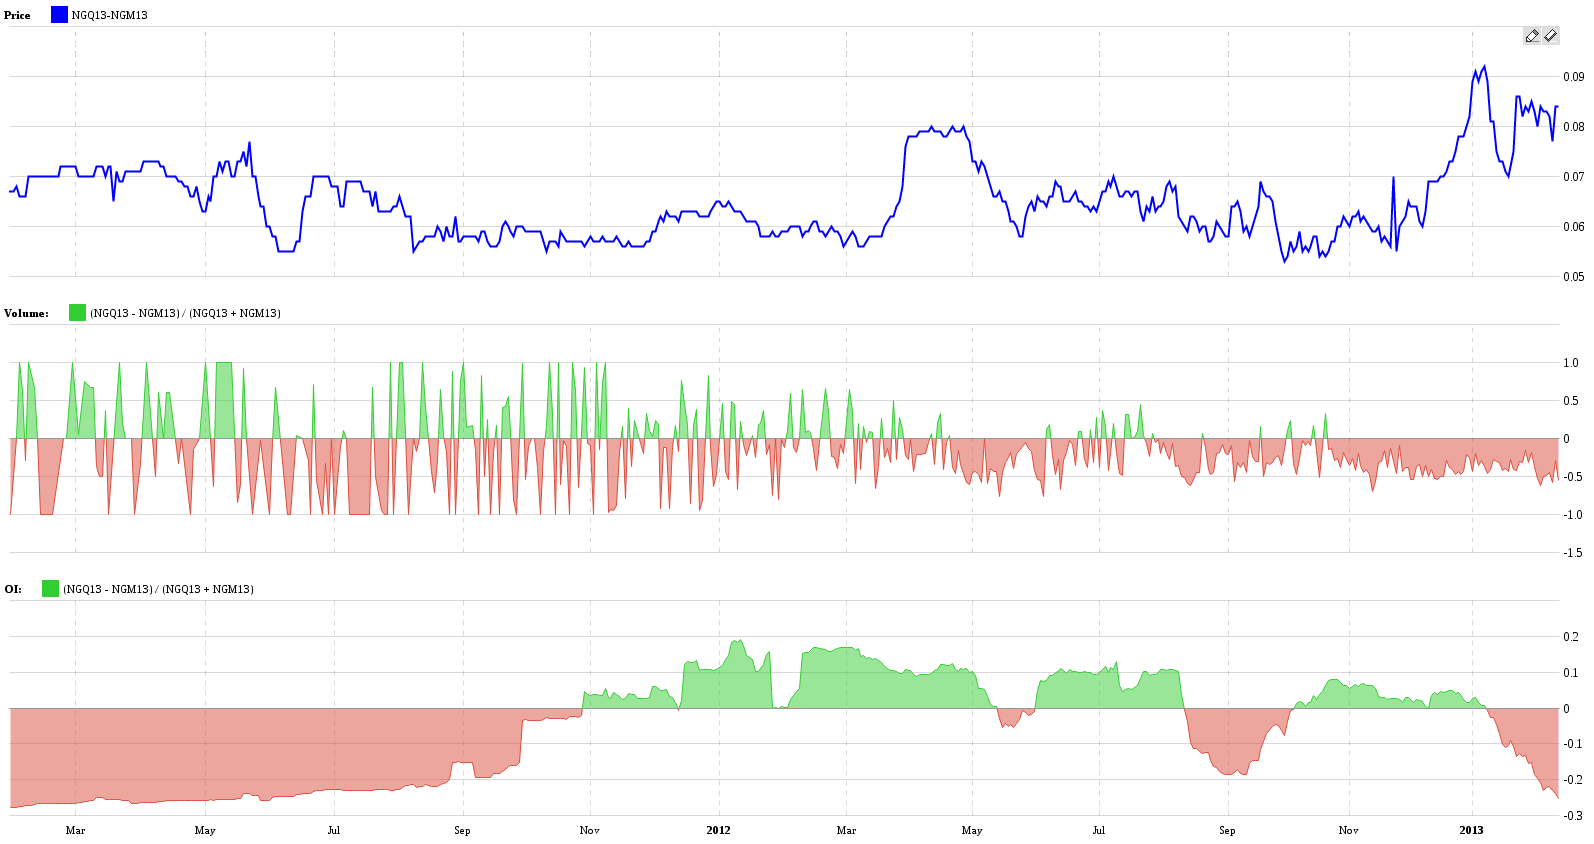
Open interest and volume have been both rising rapidly since the beginning of the year. I will also show you a chart you haven’t seen before. It’s a relative volume analysis and it’s showing some interesting dependencies between volume and OI distribution and the price. Basically, the same chart as the one above but displaying comparative analysis between both contracts. You get it simply by clicking on the “Relative” button in the bottom right corner of the volume analysis chart. Btw app.spreadcharts.com have relative analysis also for seasonality so try it out.
Check out these great articles as well
New data: Sector indices
Our software is already established well beyond commodity market analysis. Stock indices, currencies, and even...
Read moreWhat’s new in the SpreadCharts app?
It’s been a few months since we launched the new version of the SpreadCharts app....
Read moreA major new version of the app is here
Today, we’re excited to show you the major new version of the SpreadCharts app that’s...
Read moreLiberation Day!
Tariffs are arguably the dumbest part of Trump’s agenda. Yes, the goal makes perfect sense,...
Read more