Sugar reversal
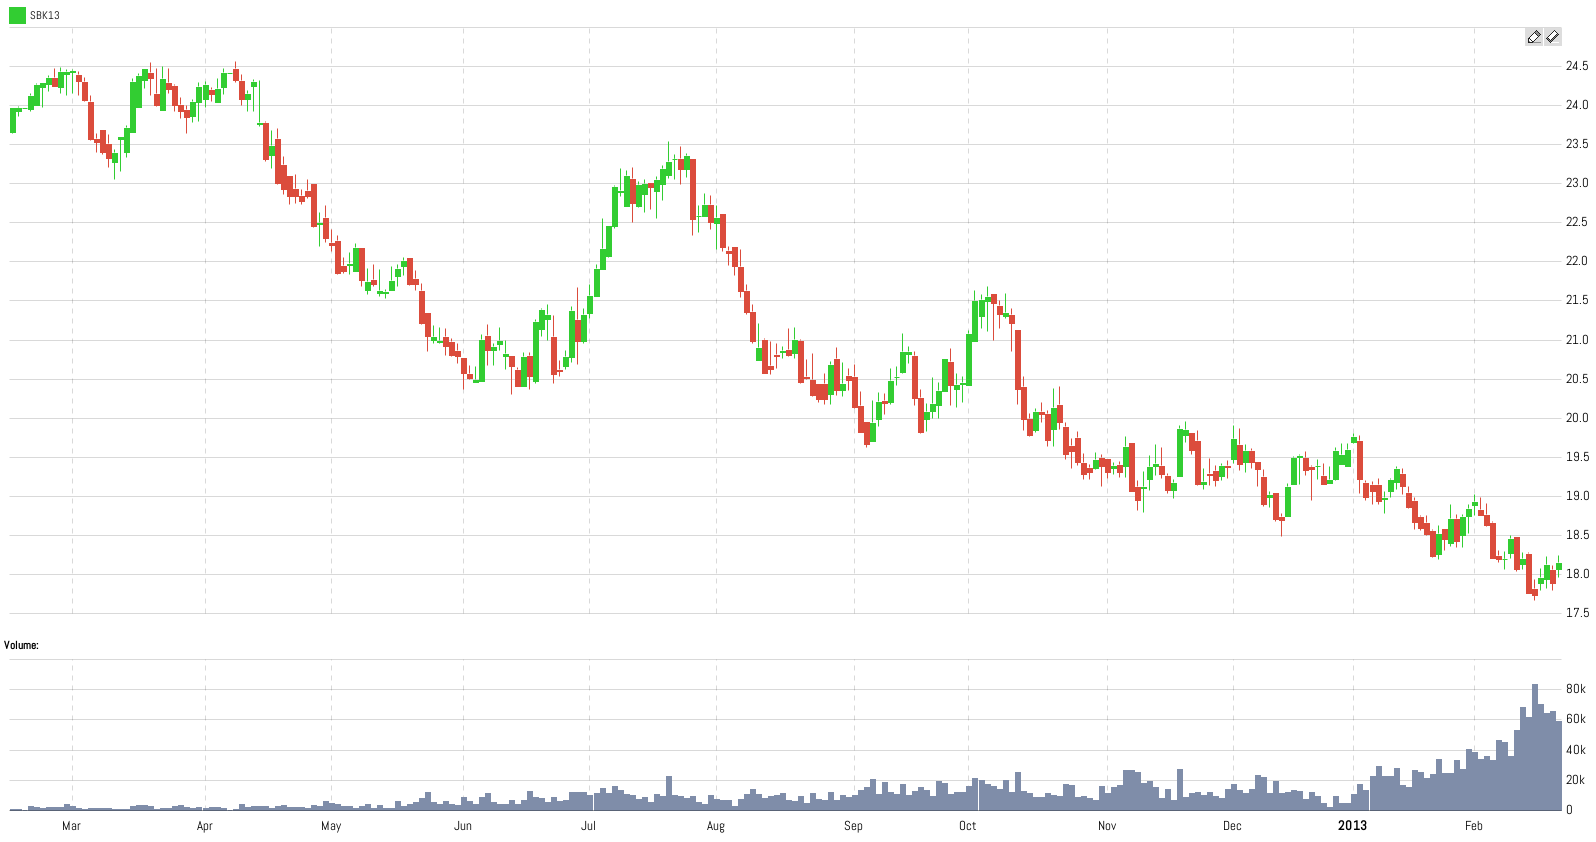
Sugar has been in a downtrend for quite some time. I think this is about to change. This is the daily OHLC chart from app.spreadcharts.com:
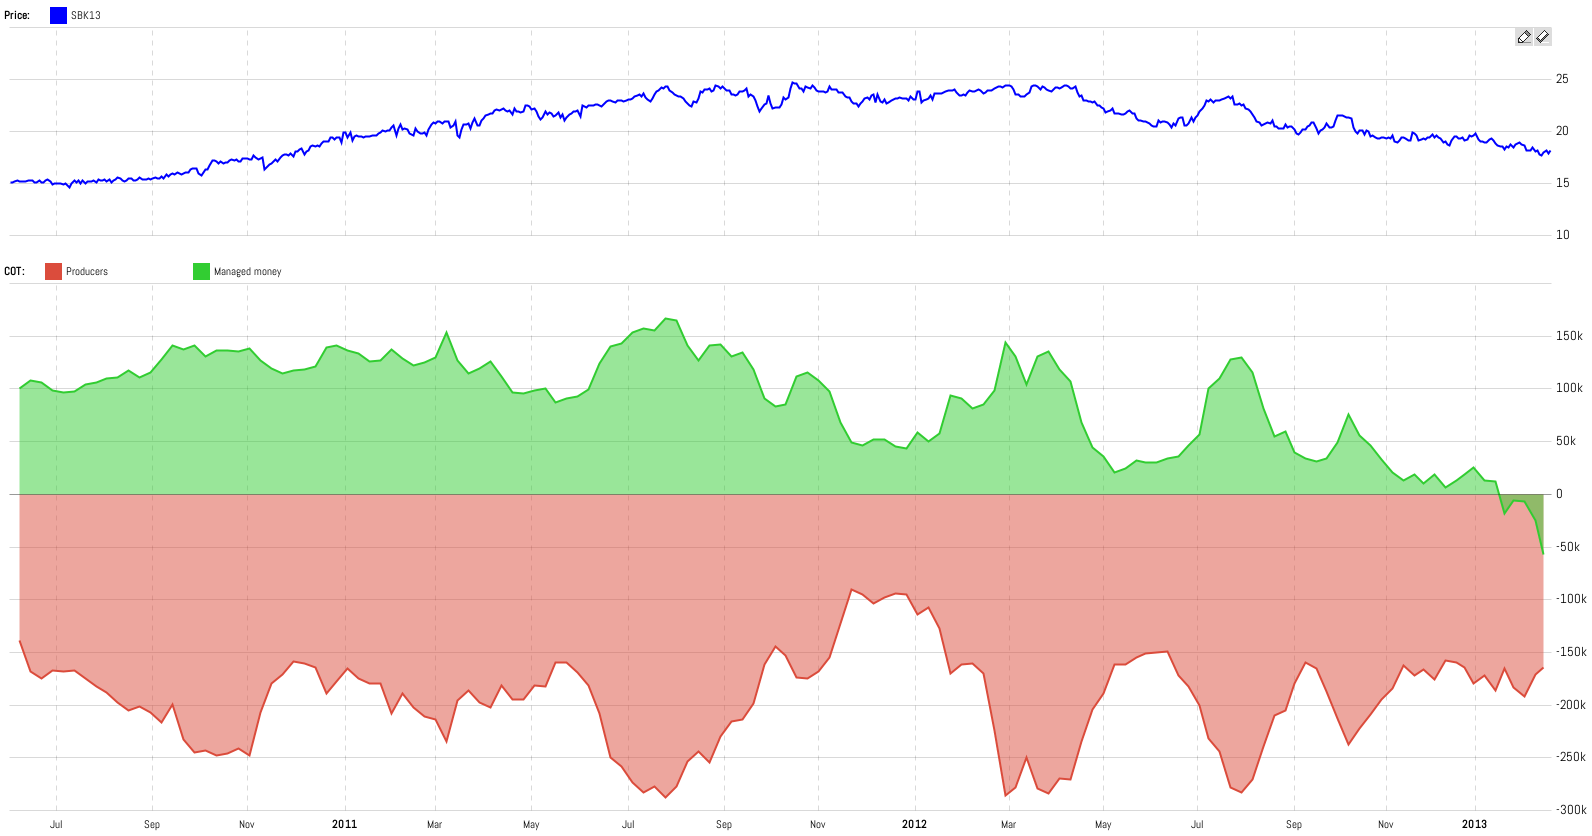
Yep, no sign of a turnaround. So why do I think this may happen? Because of the internal structure of the market, i.e. distribution of futures positions between particular market participants. Simply said, I’m talking about the Commitments of Traders (COT). The next study shows the COT absolute positions chart:
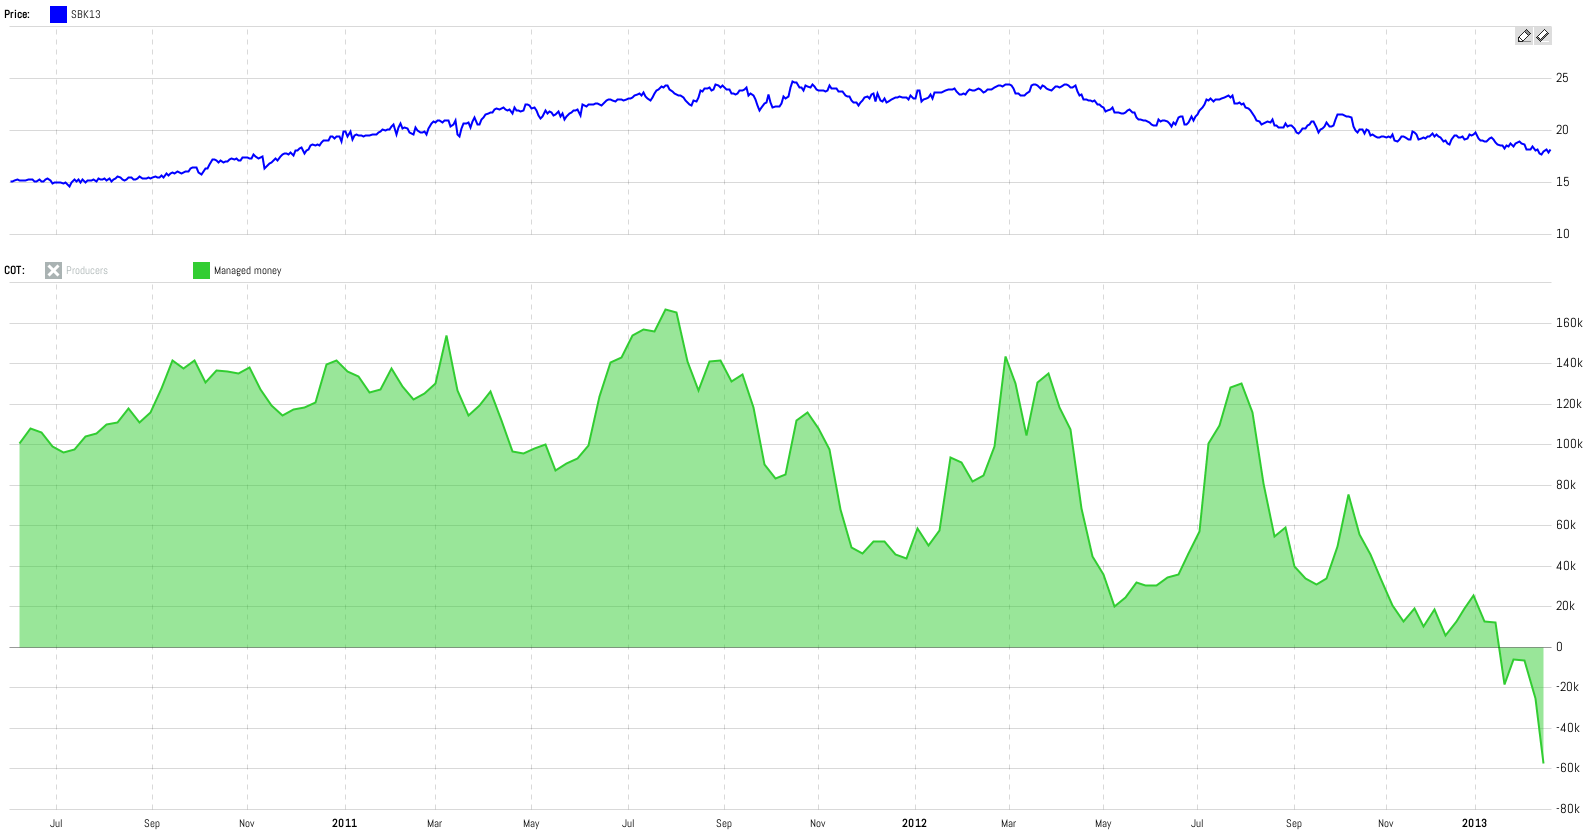
Let’s explain it a little bit. The red line is composed of net positions (long – short) of producers, mercs, processors. These people are hedgers, they come to market to hedge their risk, not to speculate. On the other hand, the green line represents positions of money managers, i.e. large speculators. Both of these groups have a large influence on the market. Look at managed money only:
It has a positive correlation with price. And it recently turned negative which is very unusual in the sugar market. And very bullish.
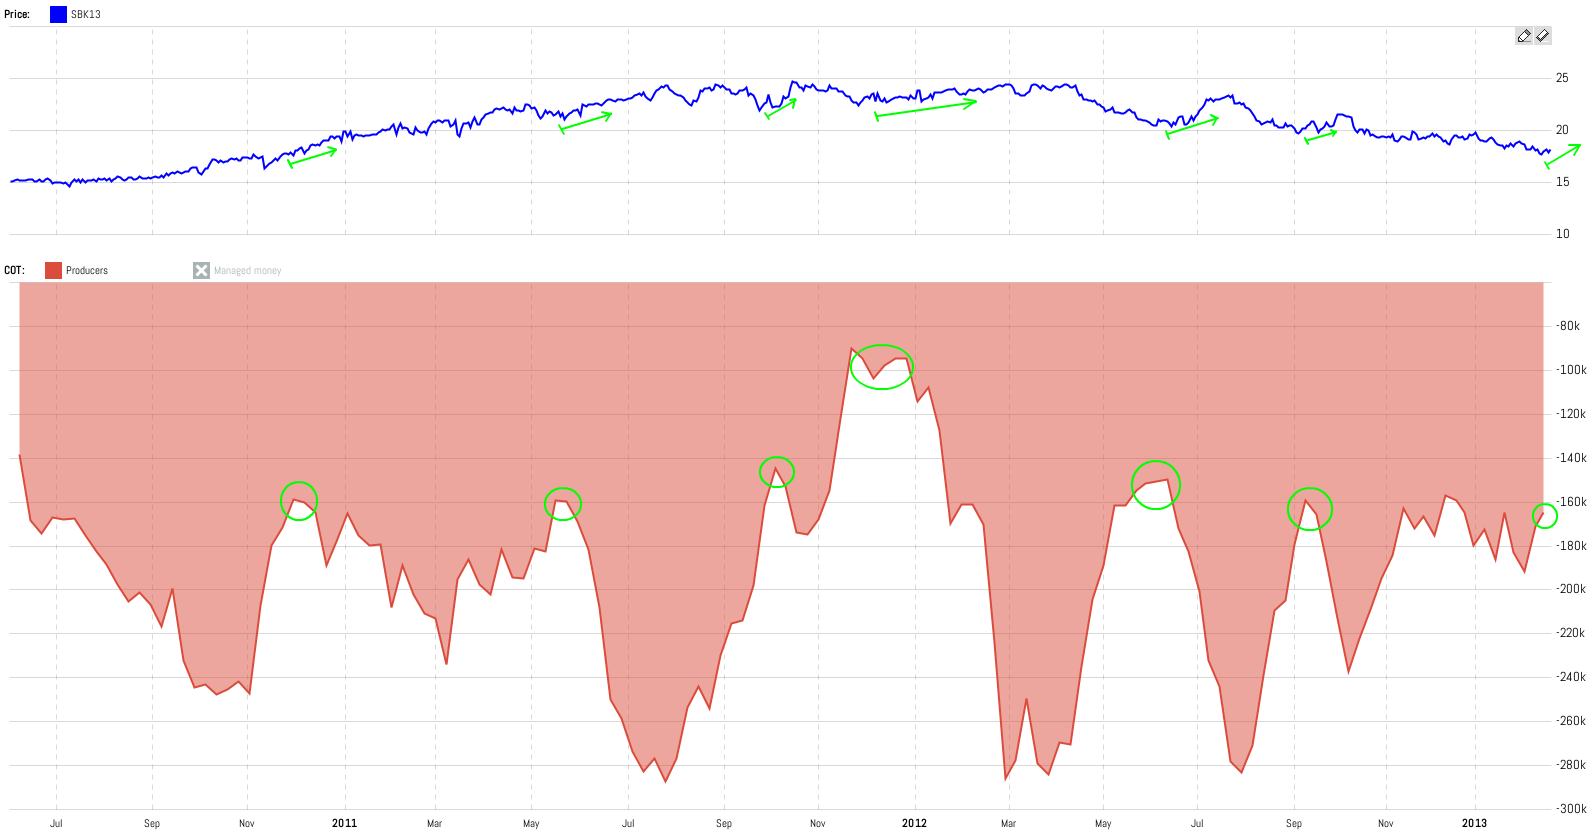
An even more important group is producers etc. To make it even more obvious I highlighted certain point in this study:
Remember these people are hedgers. Therefore, the position curve has an inverse correlation with the price. I marked the turnaround points. It’s interesting that those turnarounds in hedgers positions trend (and therefore price) happen near the same level which is -150k. And this is the level we are approaching now. And I think that’s exactly the reason why we will see a reversal from the current downtrend.
Check out these great articles as well
New data: Sector indices
Our software is already established well beyond commodity market analysis. Stock indices, currencies, and even...
Read moreWhat’s new in the SpreadCharts app?
It’s been a few months since we launched the new version of the SpreadCharts app....
Read moreA major new version of the app is here
Today, we’re excited to show you the major new version of the SpreadCharts app that’s...
Read moreLiberation Day!
Tariffs are arguably the dumbest part of Trump’s agenda. Yes, the goal makes perfect sense,...
Read more


