Cocoa/sugar ratio reveals a new opportunity
Ratio charts can show us many interesting things. They can reveal supports and resistances where’s a high probability of turnover. One such interesting situation can now be seen in the cocoa/sugar ratio.
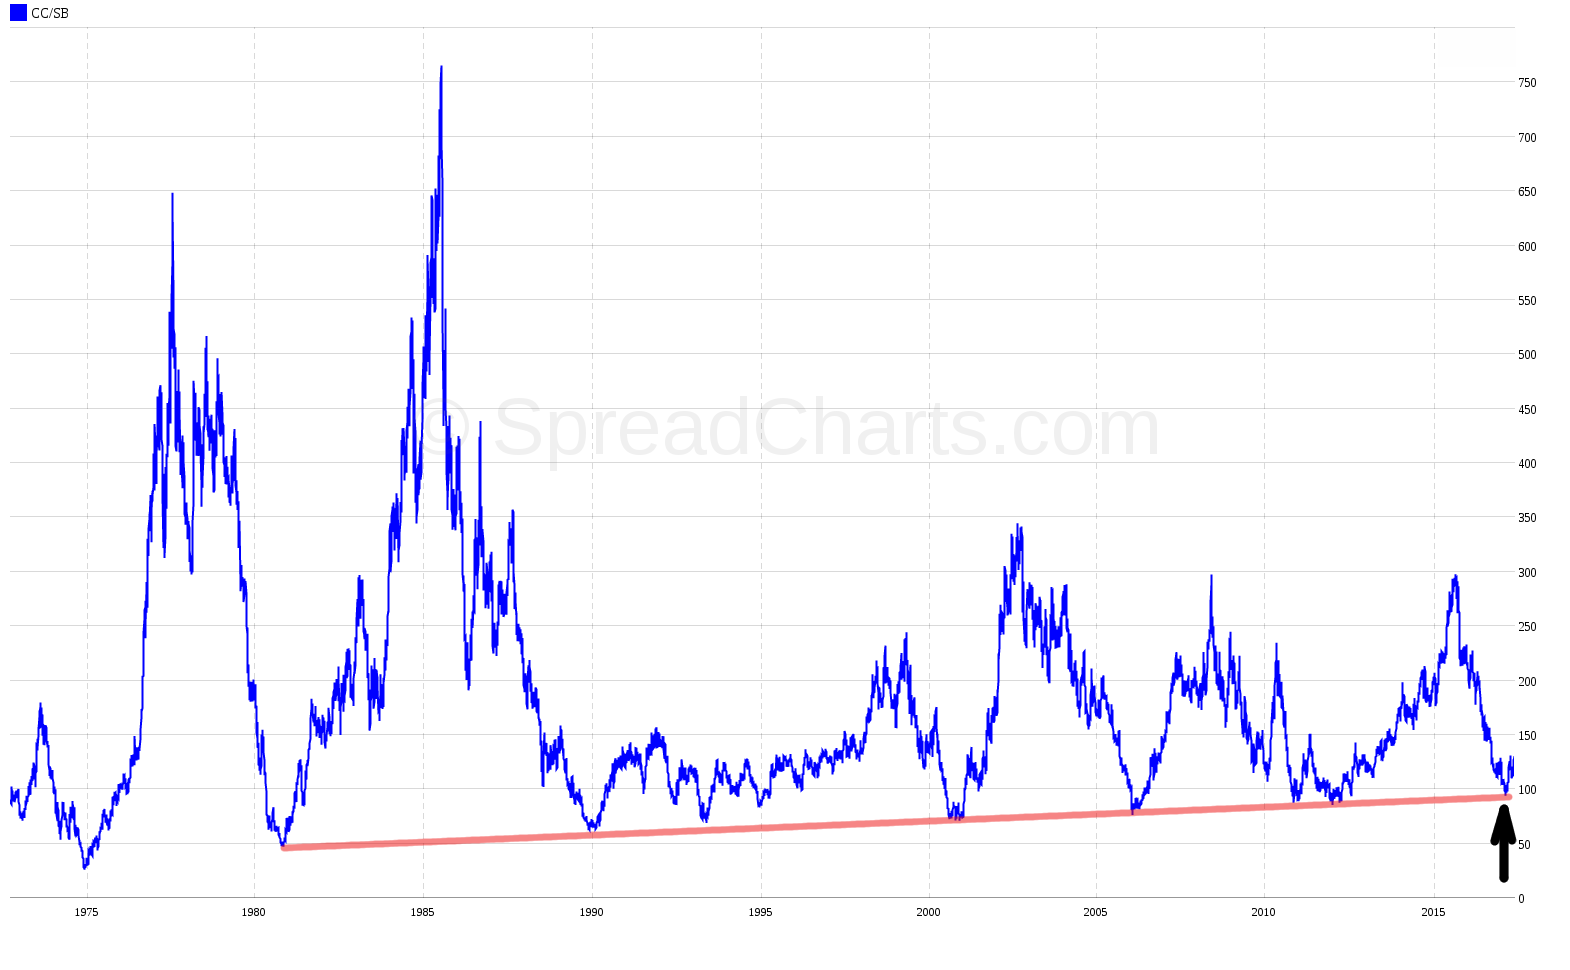
Take a look at the following chart. It’s clear that the ratio responds to support on the red line. The last time it bounced from support in February.
How could spread traders make use of this situation? It’s possible to take advantage of the fact that local minima in the ratio correspond with local minima in the cocoa-sugar inter-market spread (and with local maxima in sugar-cocoa spreads). So there is a decent probability of future rise in the spread of cocoa-sugar, when we are at both local minimum and strong support and at the same time.
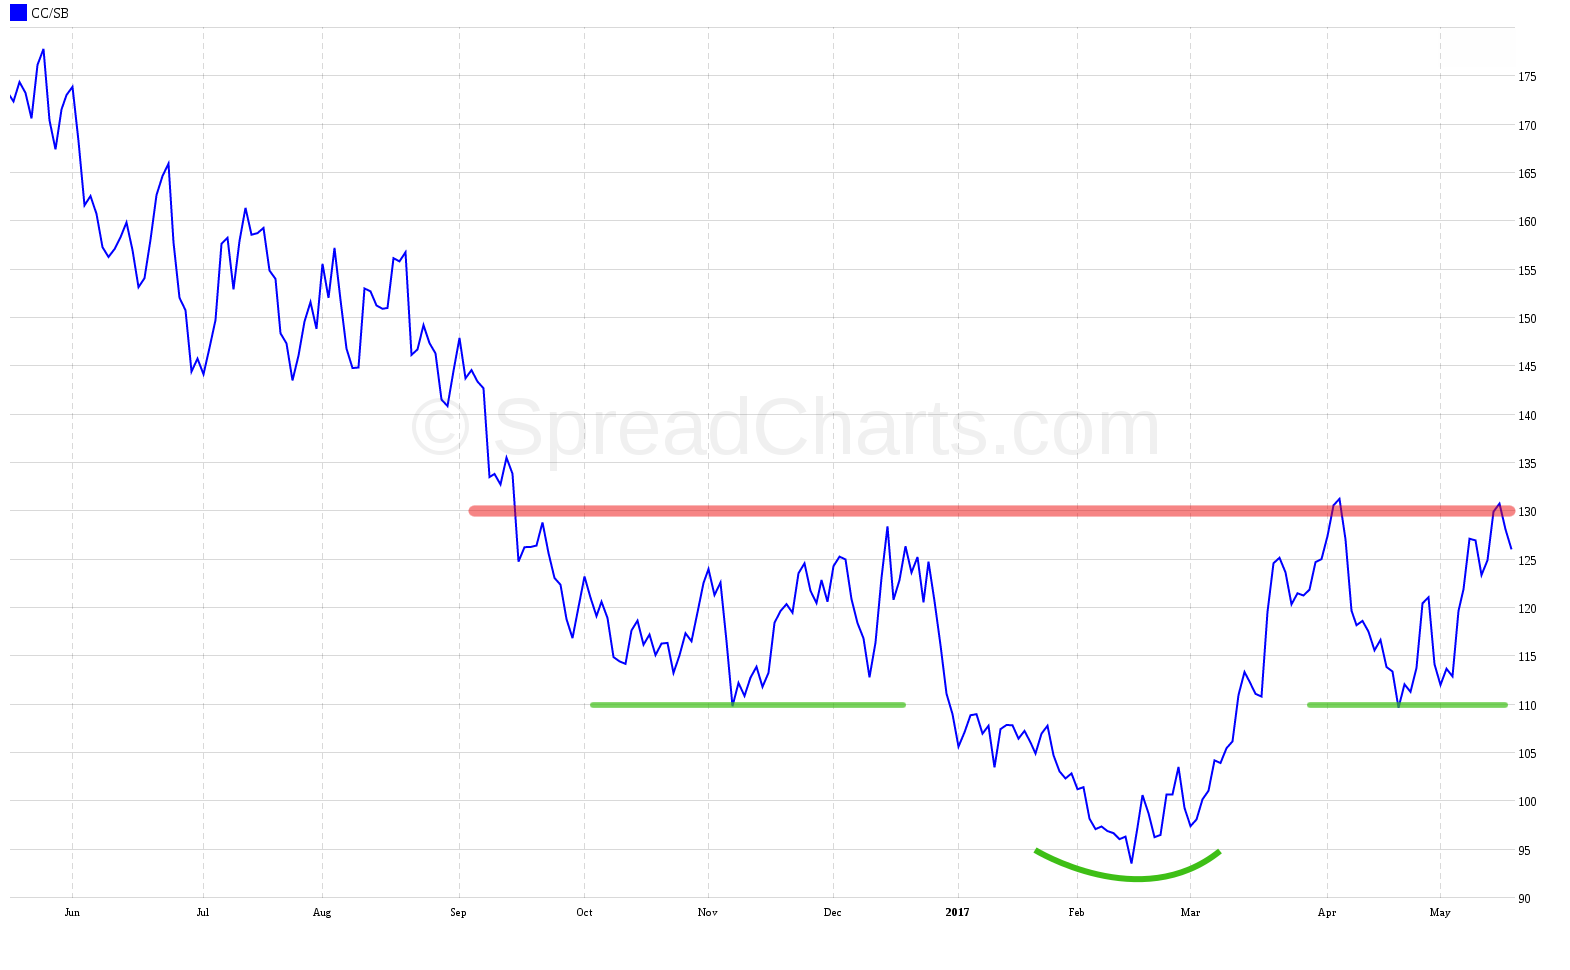
When we do a more detailed analysis of the ratio, we find out that there is also an inverted head and shoulders pattern. If the ratio breaks through the resistance in the 130 area (also called the neckline), it will be another signal of the continued uptrend.
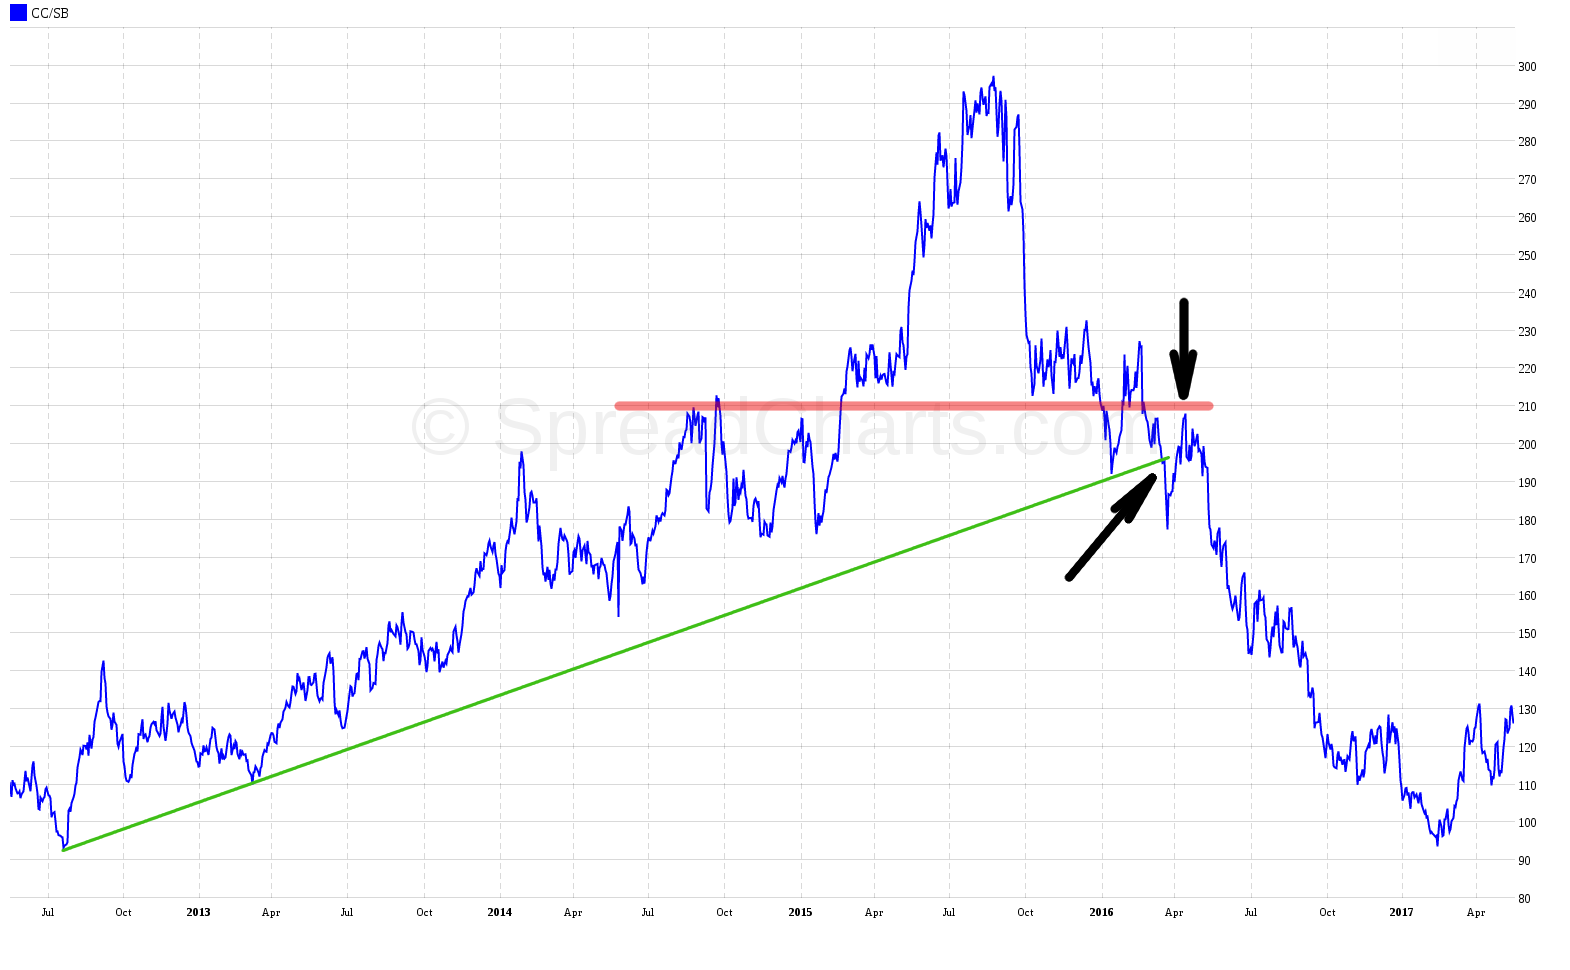
Approximately a year ago, the ratio was very high and therefore its decline could have been expected. It eventually broke below the rising trendline and remained in downtrend for a year. Cocoa-sugar spreads declined together with it and opposite sugar-cocoa spreads made money.
Fast forward to the current situation. The ratio is near local minimum and on a strong support at the same time. There is a hint that cocoa-sugar spreads have found their bottom and have a better prospects ahead. I analyzed one of them in my latest spread report, namely the CCZ17-SBV17 spread.
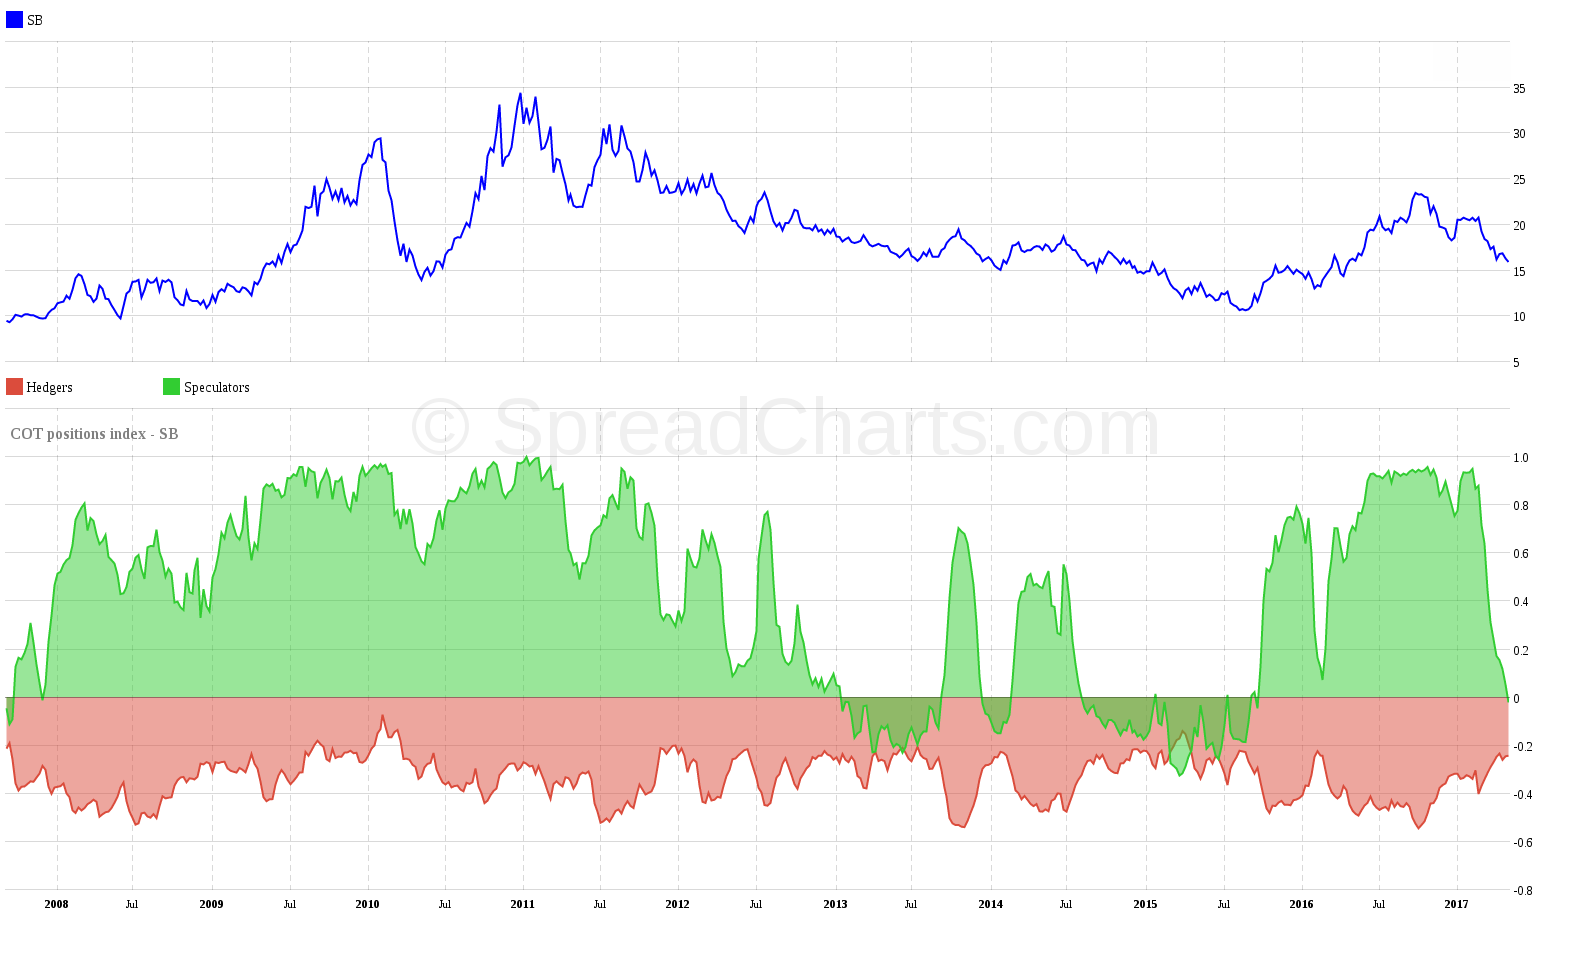
Both markets have dropped sharply and are now clearly oversold. Sugar may start to revert this imbalance sooner or faster. The intermarket spread would fall in this scenario. However when I look at the COT analysis, the cocoa market is more oversold. So the cocoa-sugar spreads have higher chance of success from this perspective.
However the decline of the ratio doesn’t have to stop immediately. If the ratio tests even lower levels, the cocoa-sugar spreads will drop again. It’s all about probability, and if a trader decides to make use of this opportunity, he should manage the risk accordingly. Intermarket spreads are much more risky than interdelivery spreads.
Check out these great articles as well
New data: Sector indices
Our software is already established well beyond commodity market analysis. Stock indices, currencies, and even...
Read moreWhat’s new in the SpreadCharts app?
It’s been a few months since we launched the new version of the SpreadCharts app....
Read moreA major new version of the app is here
Today, we’re excited to show you the major new version of the SpreadCharts app that’s...
Read moreLiberation Day!
Tariffs are arguably the dumbest part of Trump’s agenda. Yes, the goal makes perfect sense,...
Read more


