Corn market analysis
We’ve received several requests to analyze the corn market. Corn is the most liquid grain, and it’s a very popular underlying for spread traders. Therefore, it’s no wonder so many people follow this market closely.
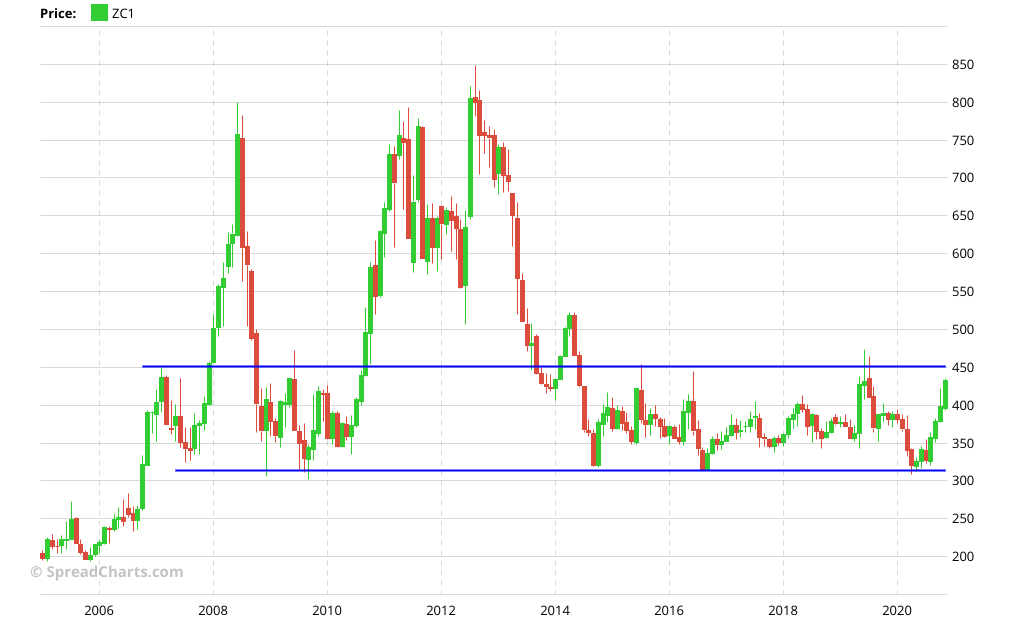
Let’s start with the technical analysis. The price is approaching resistance around $4.50. However, we don’t consider this to be outright bearish. First of all, this resistance is not a sharp boundary but rather a loosely defined area. The price may easily overshoot to 480c and only then reverse. Second, there is little doubt commodities (and not just agricultural ones) have entered a new bull market. While we’re probably at the initial stage of this bull market when the trend is not very strong, speculating against it won’t be very wise in the long term. On the other hand, corrections and short term pullbacks are normal in any uptrend.
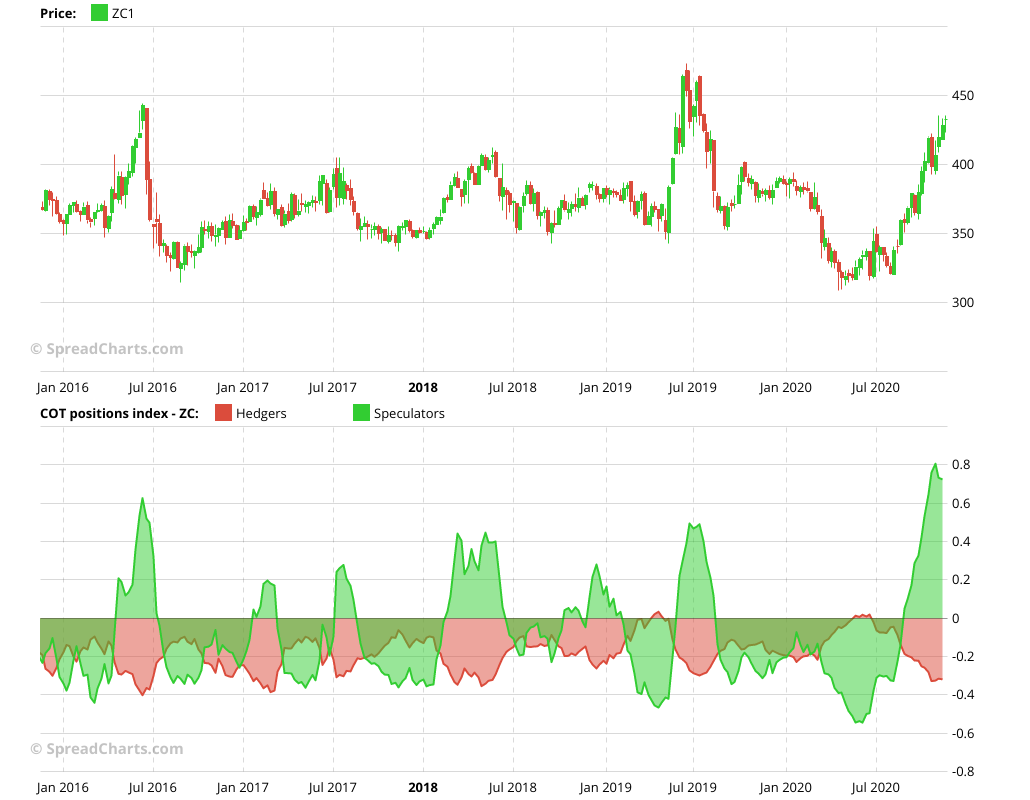
What is definitely bearish is the sentiment. The hedgers (red curve), measured by the COT position index, are heavily net short. In contrast, the managed money (green curve) are extremely net long. This is unsustainable, and a correction in price is only a matter of time.
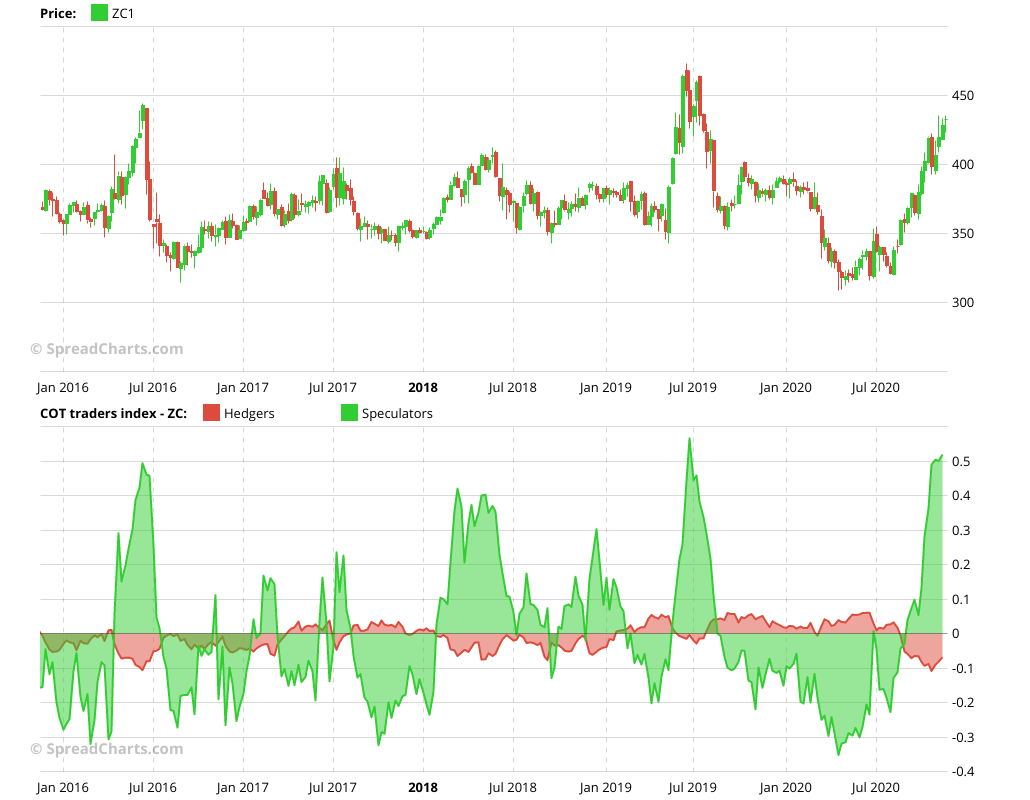
Sometimes, it’s a good idea to take a quick look also at the number of traders. Here’s the COT traders index, and it’s confirming the conclusions from the position index.
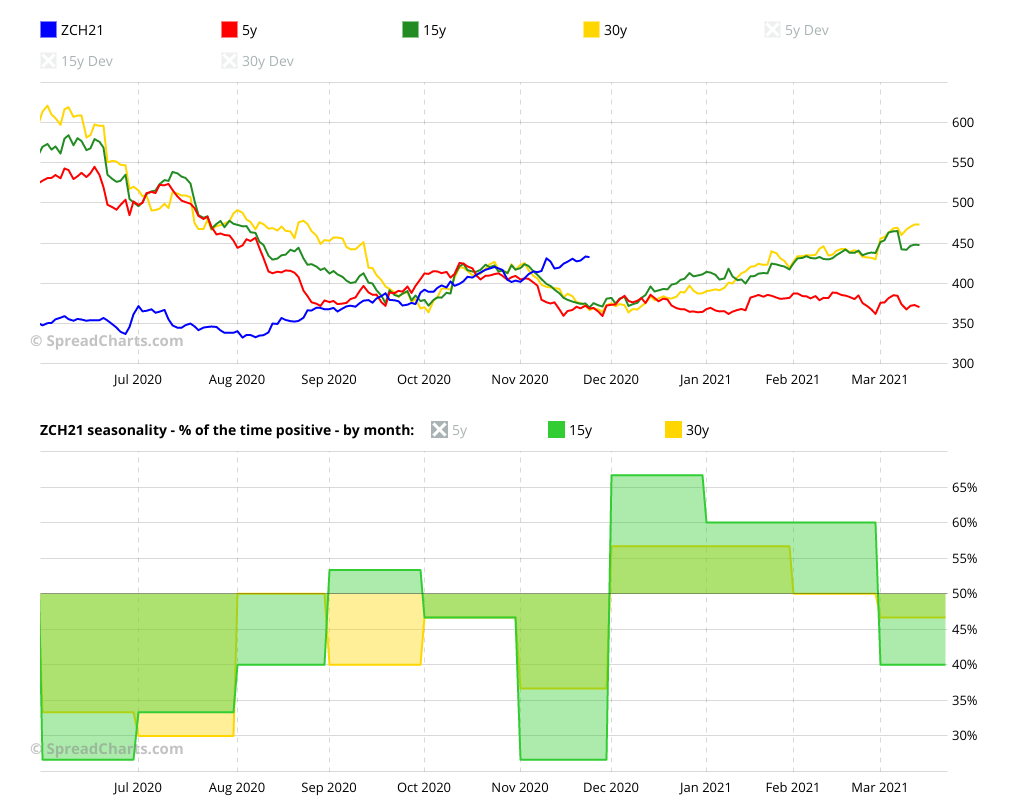
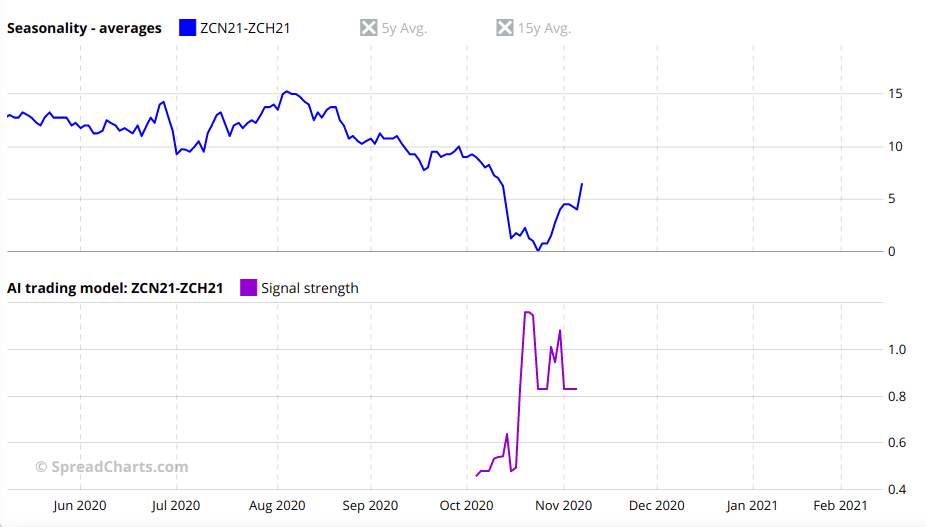
I will briefly mention seasonality, which is favorable for corn since the start of December. The seasonal curves are trending higher, which is confirmed by the monthly statistics. However, keep in mind the seasonality can often fail, and the summer period is a prime example. It was negative for corn, but the price was moving sideways or trending higher, completely disregarding the seasonal trend.
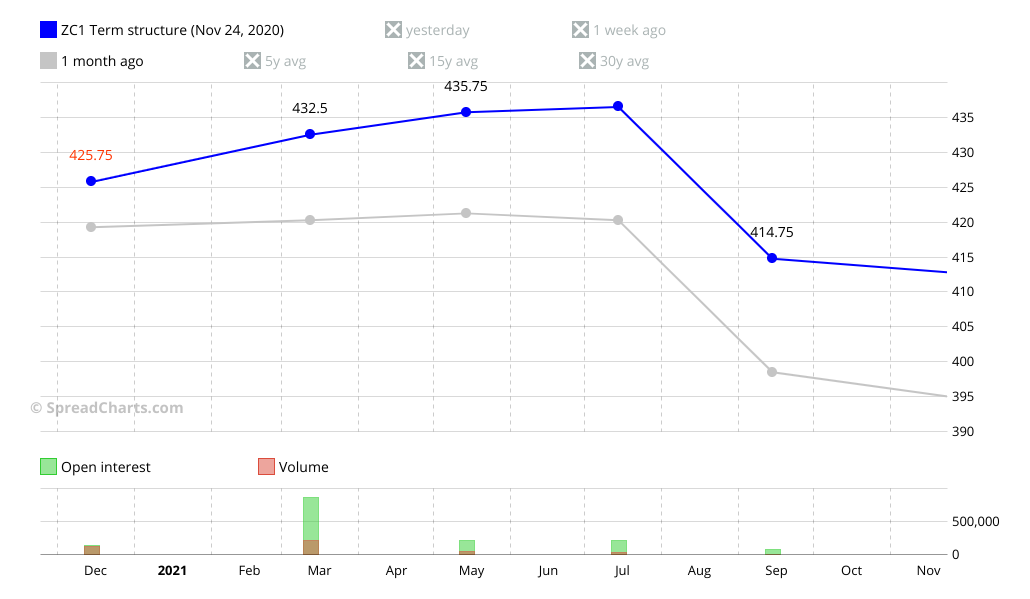
But don’t be one dimensional. You have to think about the dynamics of the whole term structure, not just a single contract. Here’s the near end of the corn’s term structure curve together with the same curve a month ago. While the prices are higher across the curve, its shape has also changed. The slope has increased, which is counterintuitive as the increasing slope (rising contango) is usually a bearish signal.
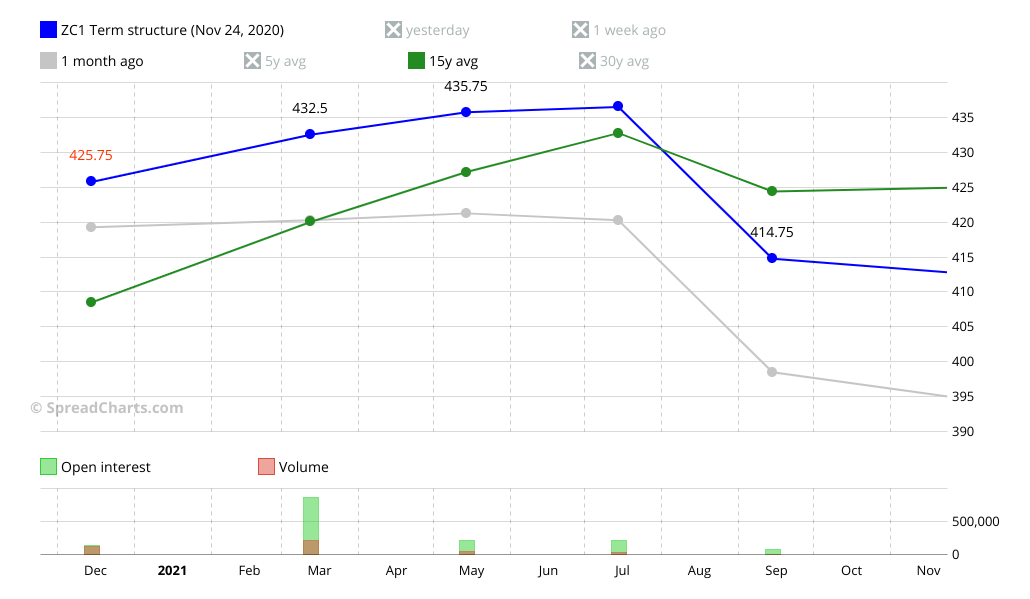
Moreover, while the contango has increased, it’s not extreme and still has a lot of room rise further. This is visible from comparing the slope of the current blue curve with the average 15-year curve at this time of the year.
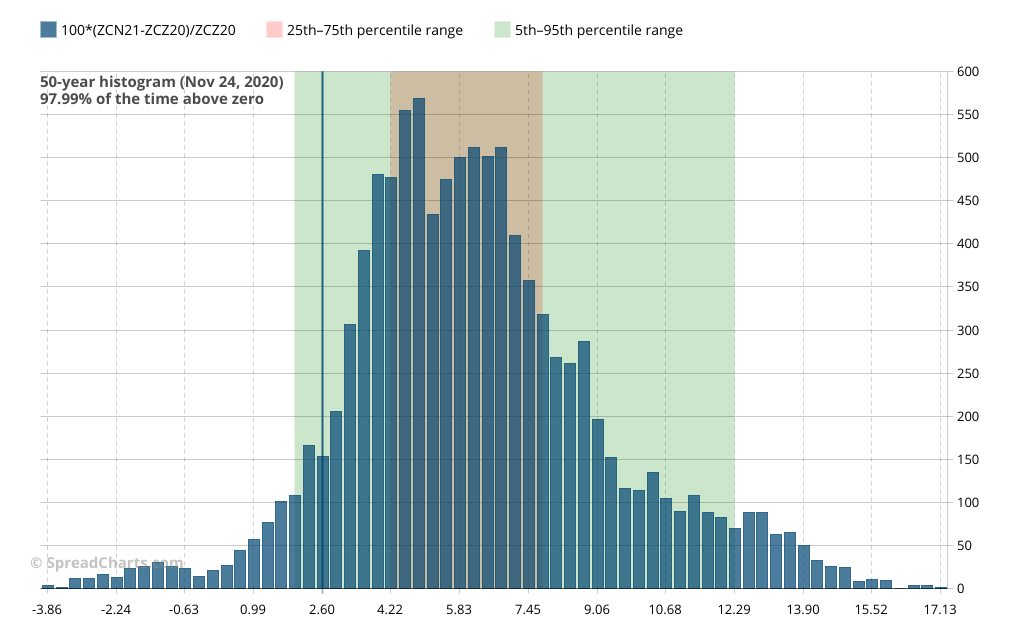
If you consider 15 years to be a small statistical sample, let’s take a look at the 50 years of contango distribution between the first and last contract of the US corn crop. The contango is obviously rather weak as it is close to the left green boundary (5th percentile).
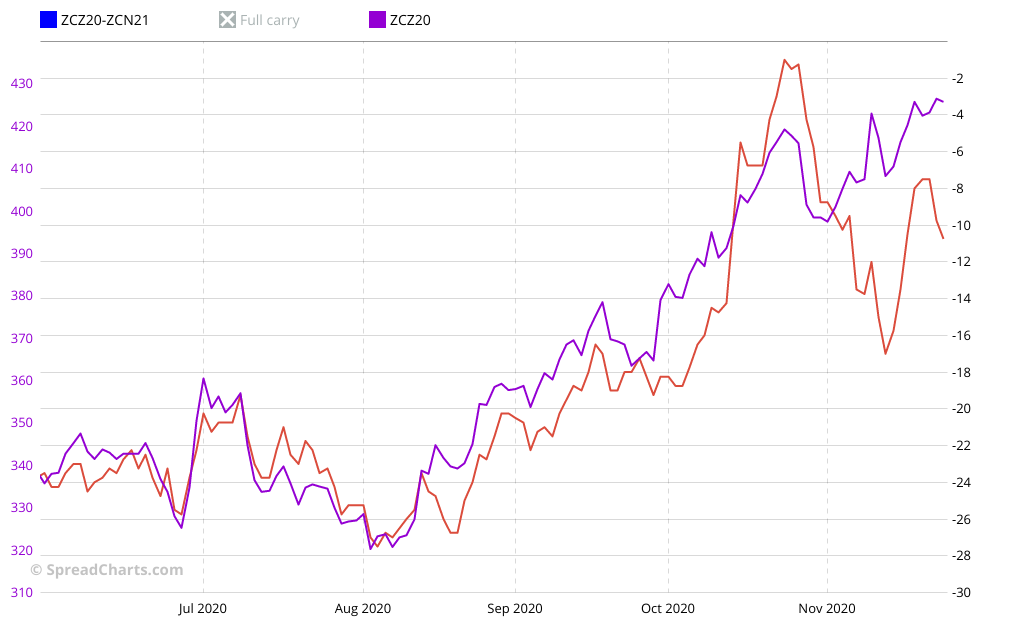
The weakness in the market is mostly (but not always) first apparent on interdelivery spreads. This time is no exception. There is a clear divergence between the bull spreads and the underlying commodity.
Bear spreads were obviously a better way how to play this opportunity. It is sometimes hard to spot the right spread among the endless number of combinations in corn and other commodities. Luckily, our Artificial Intelligence issued a valid signal for this bear spread in the middle of October, so you haven’t missed anything.
And what about shorting the corn itself? It looks like a good opportunity. But is it a great opportunity? Probably not. The main drawback is the fact this is a counter-trend opportunity in the emerging bull market. Still, with proper risk management, it will be a profitable short-term swing for many traders.
There are much better opportunities in the energy sector or the intermarket strategies we revealed to you more than a week ago.
A new research video is on https://t.co/j2kBYXIYSv📊
We found two intermarket strategies that are known for making money even during difficult times. The first opportunity is among the soft commodities, while the second one is in meats.#OJ_F #SB_F $CANE $SGG #HE_F #LE_F $COW pic.twitter.com/s6cYAU5M1J
— SpreadCharts.com (@SpreadChartsCom) November 16, 2020
They are available to our premium users in the Research section of the SpreadCharts app. Subscribe in the app or on our website if you want to stay ahead of the crowd.
Check out these great articles as well
New data: Sector indices
Our software is already established well beyond commodity market analysis. Stock indices, currencies, and even...
Read moreWhat’s new in the SpreadCharts app?
It’s been a few months since we launched the new version of the SpreadCharts app....
Read moreA major new version of the app is here
Today, we’re excited to show you the major new version of the SpreadCharts app that’s...
Read moreLiberation Day!
Tariffs are arguably the dumbest part of Trump’s agenda. Yes, the goal makes perfect sense,...
Read more