Gold is breaking down
You all saw the selloff in gold over the last few days. It has done some technical damage, and many have started to question the uptrend’s sustainability, at least in the short term. We decided to make this series of charts, not because we know where the price will move, but because we can help you filter out the noise and point the key details that will dictate the gold’s direction.
Just don’t forget this article is about short to medium-term outlook. Long term picture remains bullish. We’ve been long-term bullish gold since 2018 as you can check yourself in our older premium research videos.
Bearish charts
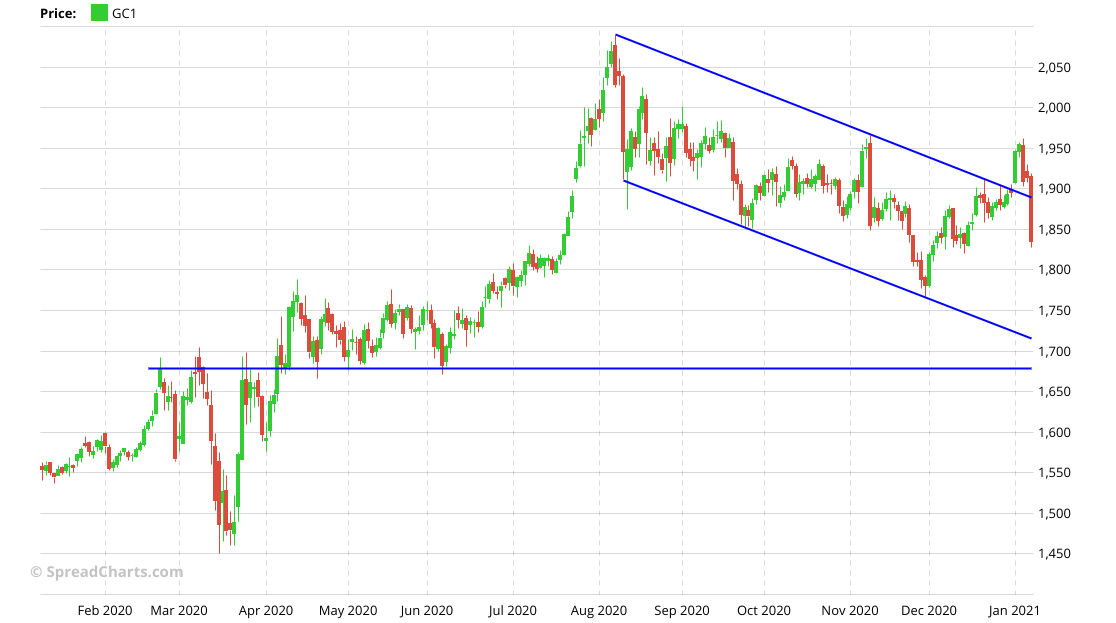
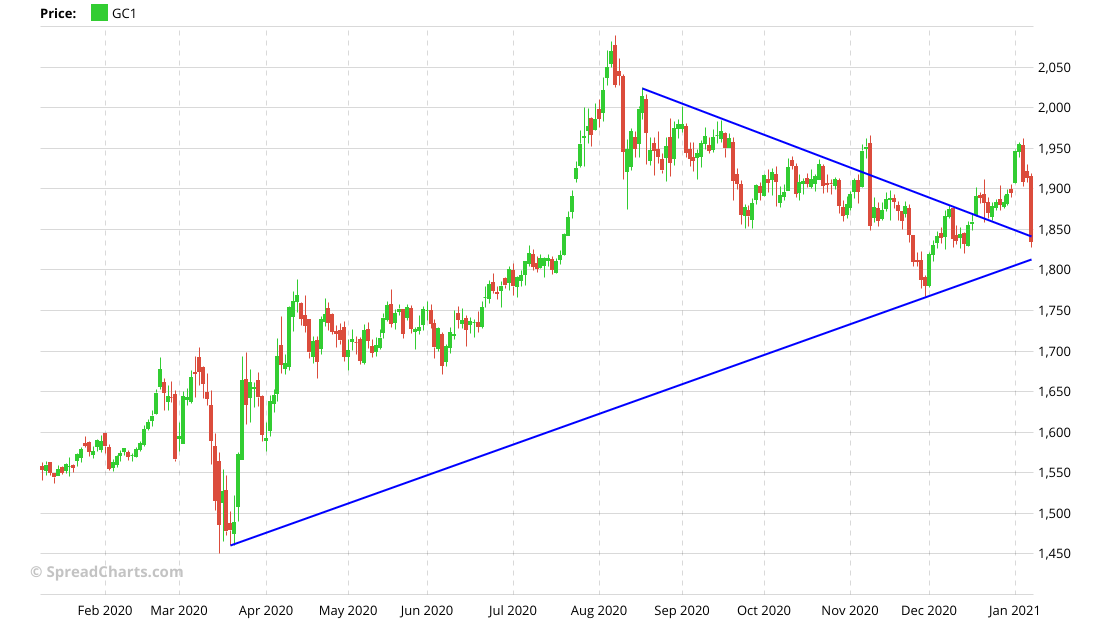
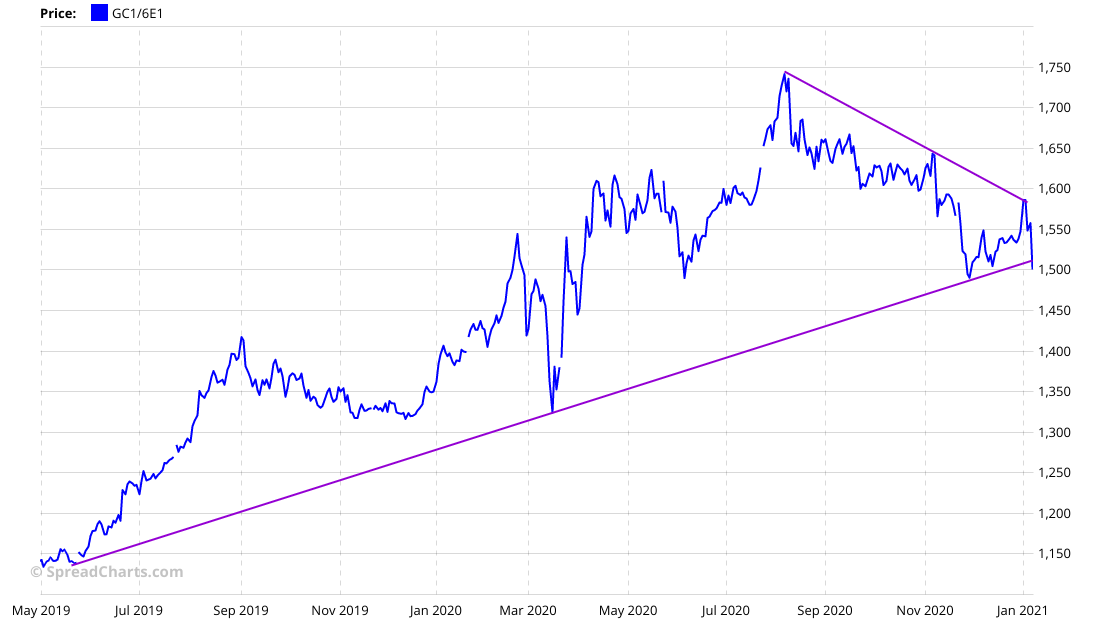
Let’s start with the bearish studies. Some of them are quite obvious. It’s clear now that the recent breakout was fake. We’re back in the flag formation that has guided gold’s price since August last year. Every failed breakout is obviously bearish, and a retest of the flag’s bottom trendline seems likely. Below that trendline is an important support at $1680.
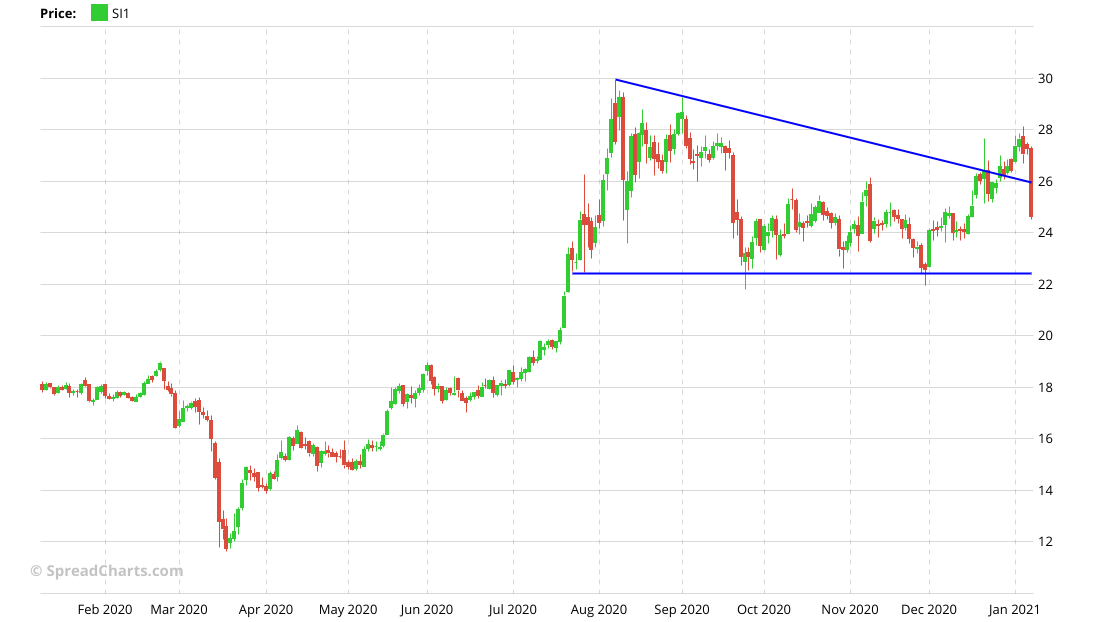
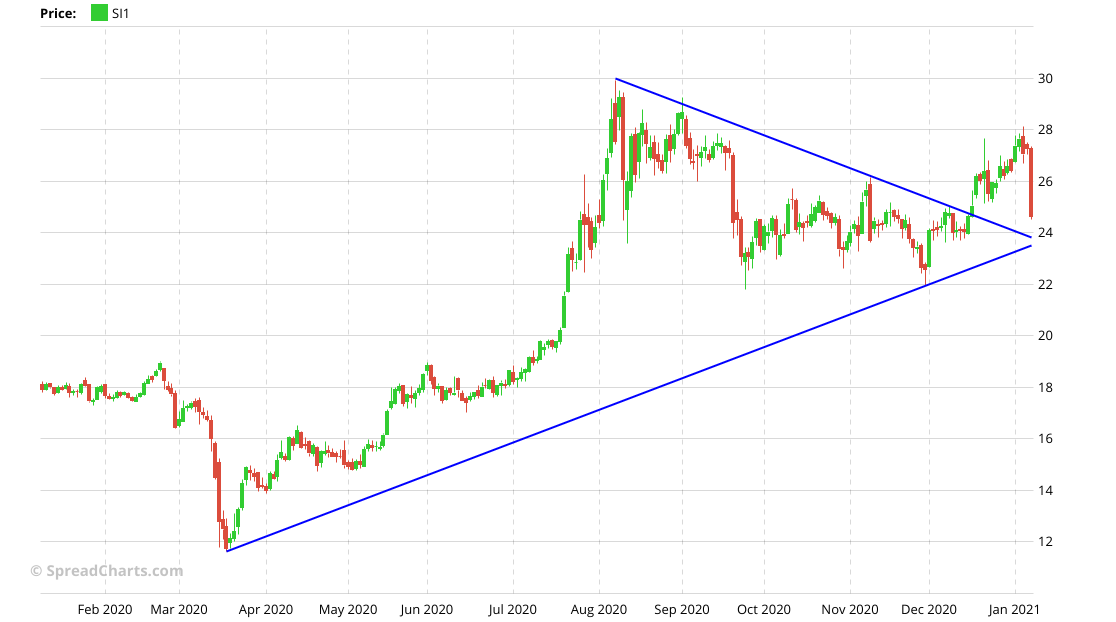
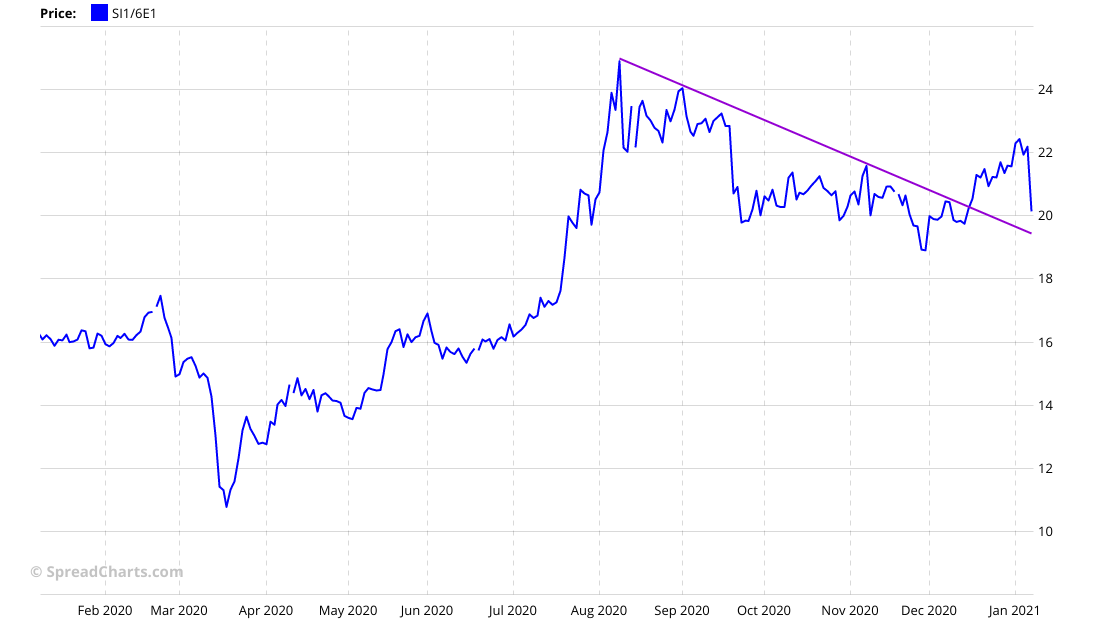
It’s not just gold. Silver also failed in its breakout, which implies at least a retest of $22 support.
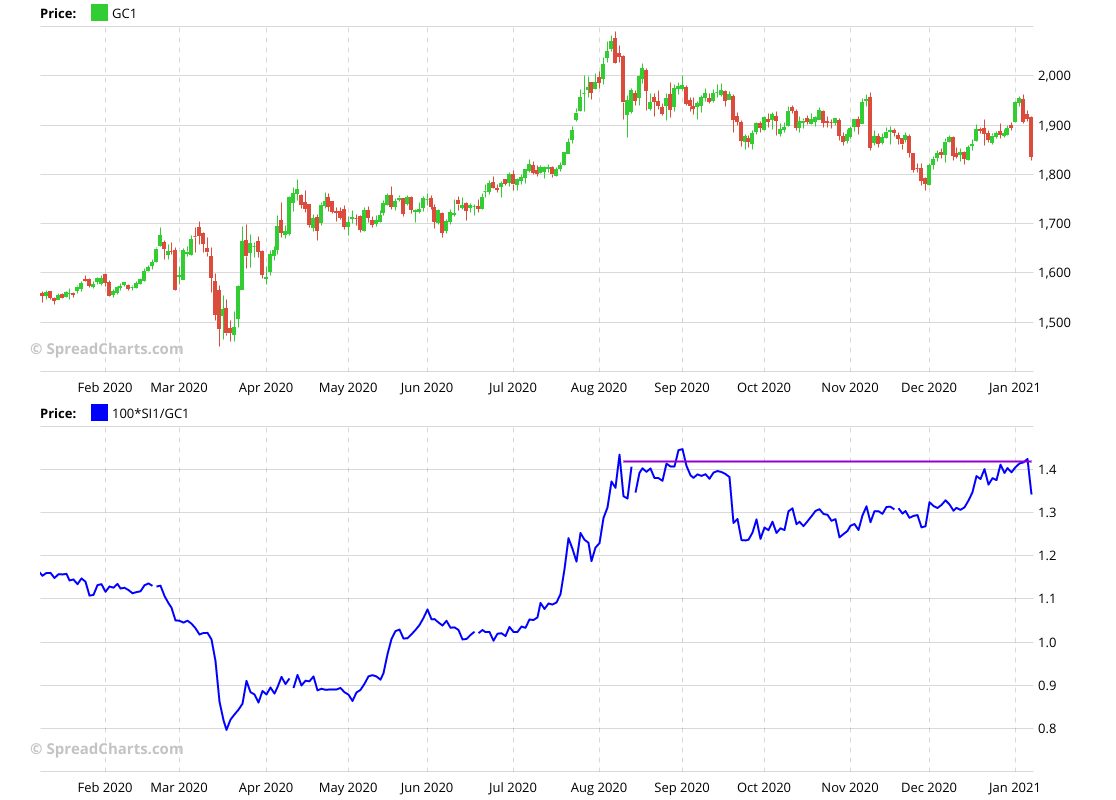
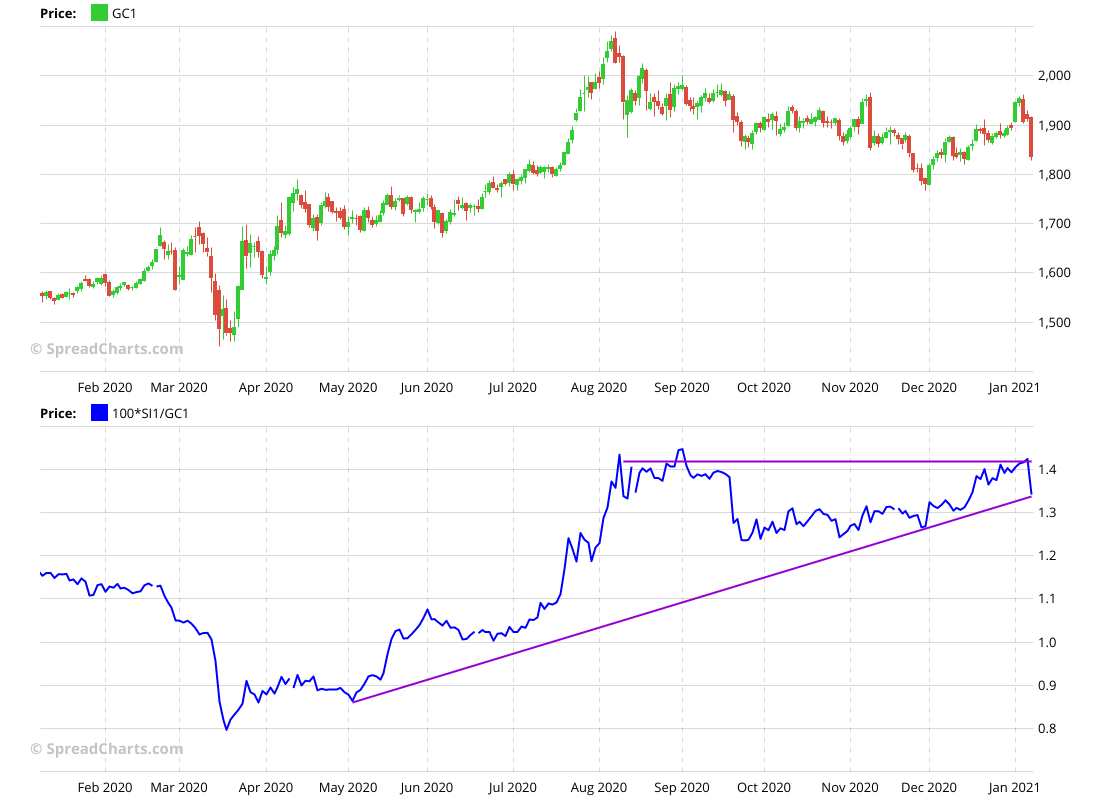
Speaking about silver, the important gold/silver ratio (silver/gold on the chart) made a double top. Further weakness should be bearish for the precious metals overall.
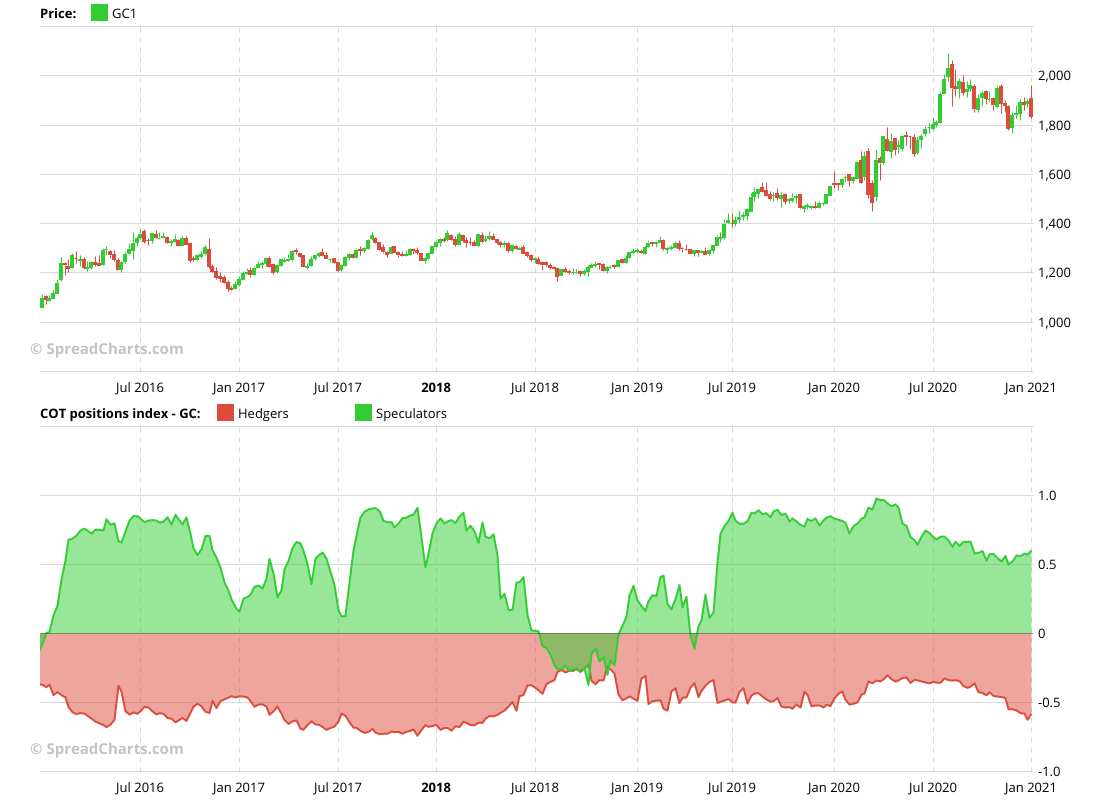
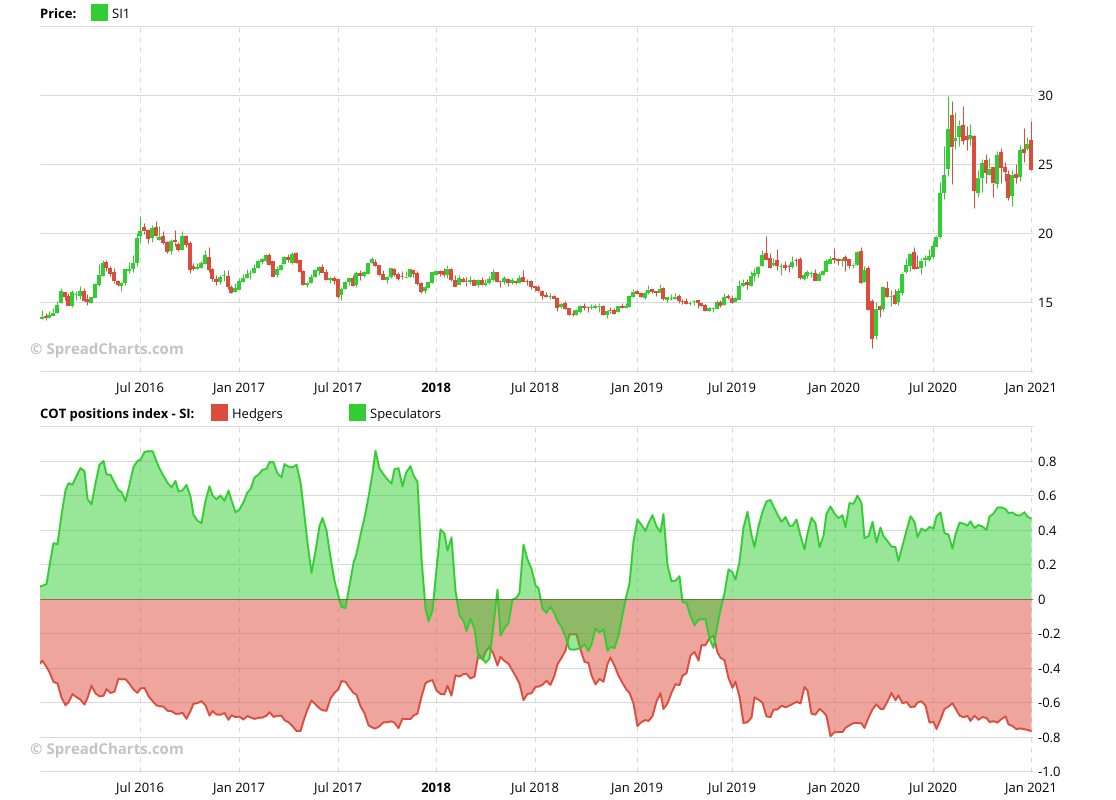
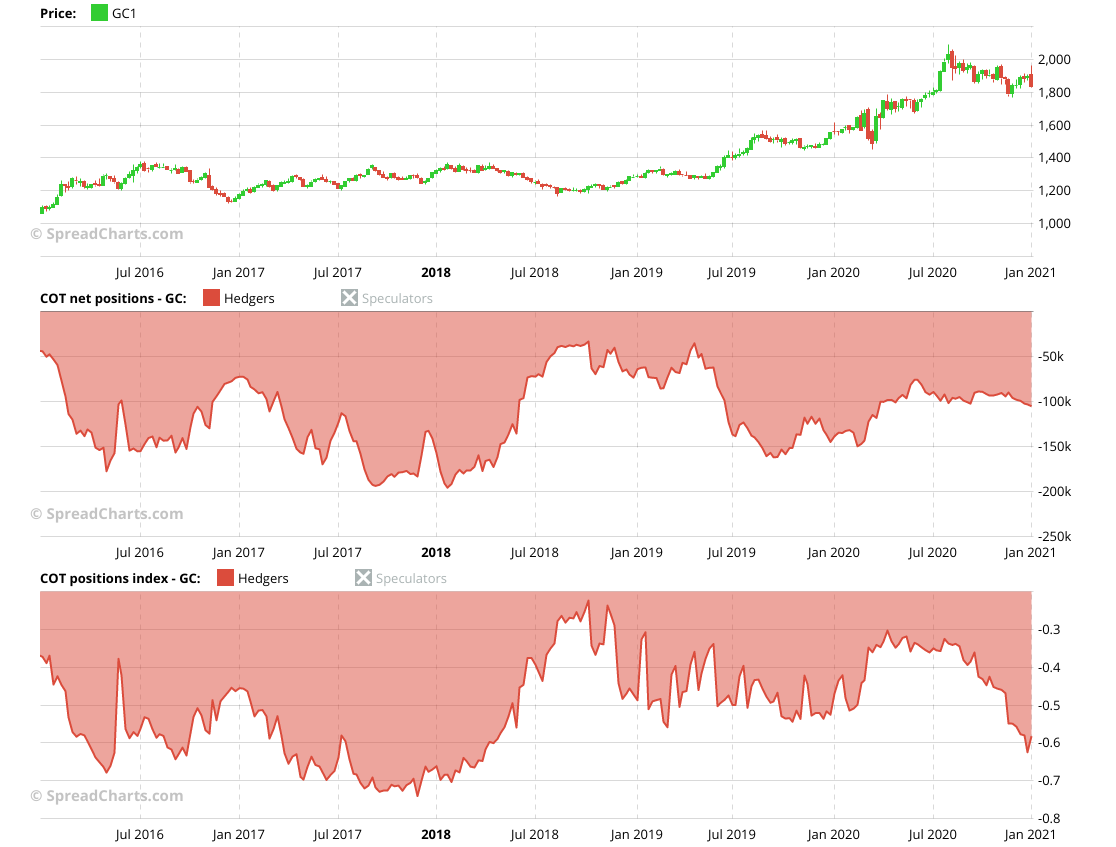
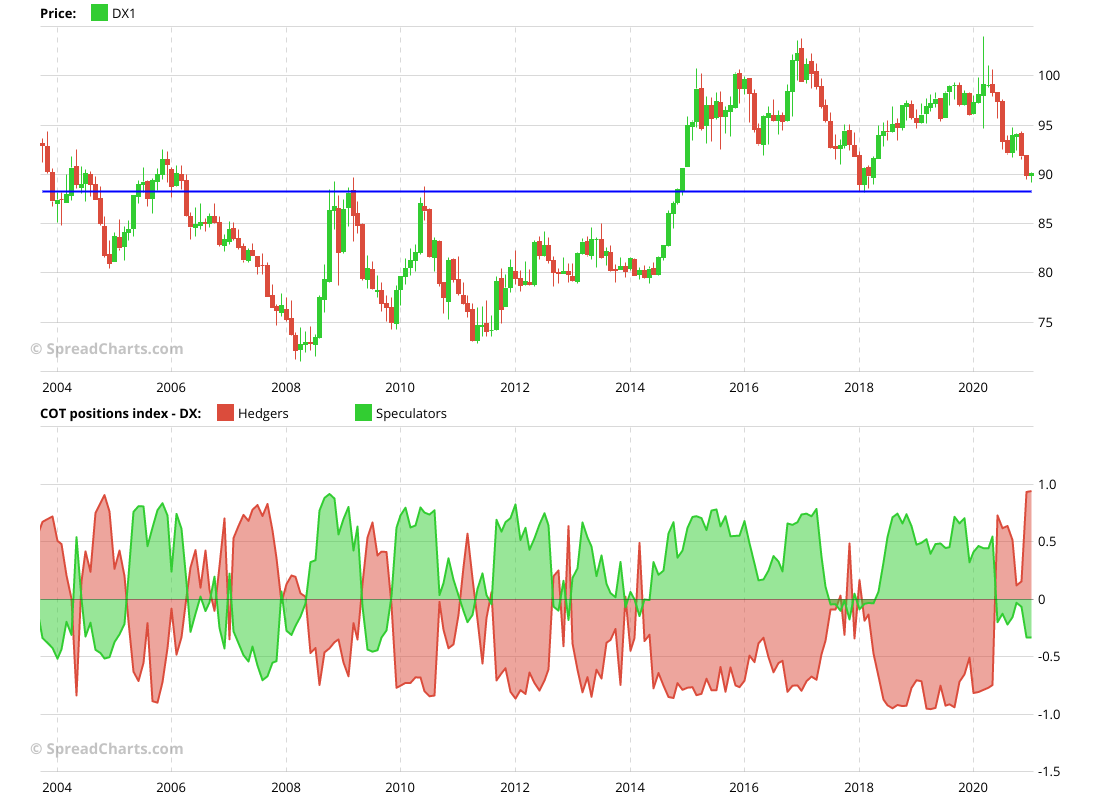
Positioning and sentiment are important indicators. There is no better sentiment indicator for gold than the Commitments of Traders data published by the CFTC. The COT index for large speculators is neutral, while the hedgers are bearish. That’s not good for gold.
The same study for silver pains roughly the same picture.
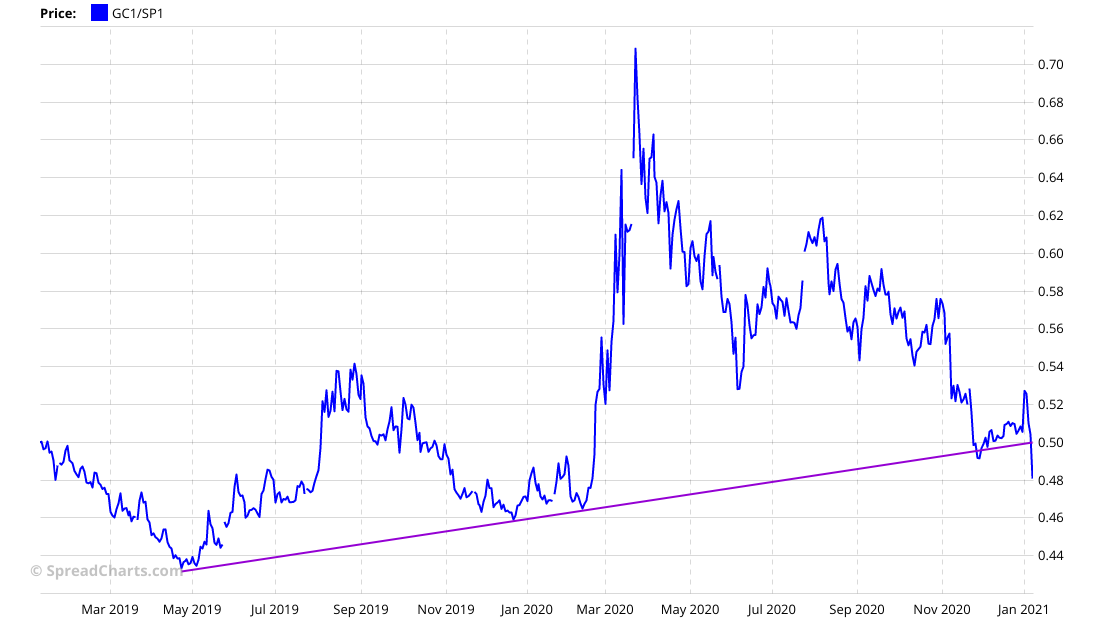
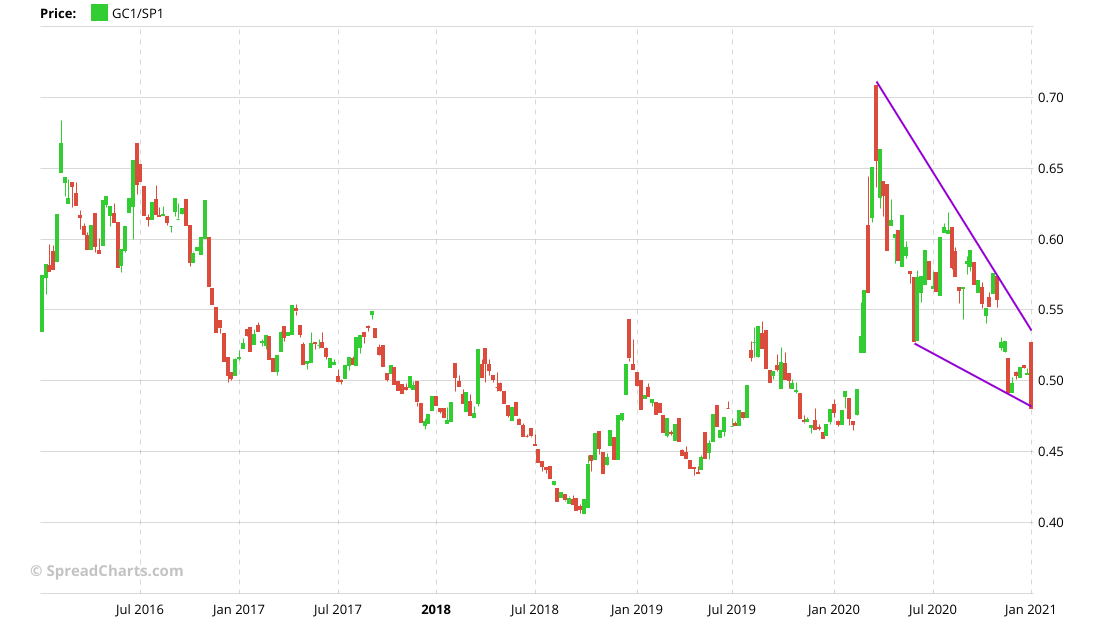
And finally, the ratio between gold and stocks (S&P 500 futures) shows a clear breakdown. This may suggest the money is flowing to riskier assets like stocks.
Bullish charts
There’s always been a conflict of data/indicators/opinions in the market. This situation is no exception. Let’s start with the technical analysis. While there is no denial of the flag’s failed breakout, maybe the price is just retesting a previous breakout. Maybe it’s just by chance, but the selloff stopped right at the point where two opposite trendlines converge.
This is even more clear in silver.
Moreover, the price of gold depends on who do you ask. For example, European investors care more about the price in euros rather than dollars. And there was no fake breakout on gold in euros. The price is now testing the bottom of the consolidation.
Silver priced in euros is also looking good – breakout followed by a retest (yet to be seen if successful).
We must not forget the silver/gold ratio. There is also an alternative view. Despite the selloff, the curve remains within the symmetrical triangle pattern, which is usually resolved by breaking higher. However, the bottom trendline must hold.
What about the not so favorable COT data? Well, if you look closer, you’d find an unusual discrepancy between net positions and the COT position index. The net positions are much less bearish, more like neutral. The conclusion is simple. While the current hedgers’ positioning is rather bearish, open interest has fallen as many hedgers are not hedging at all. That’s not so bearish anymore.
What about the breakdown on the gold/S&P500 ratio? Well, if you zoom out, it starts to resemble a bullish falling wedge.
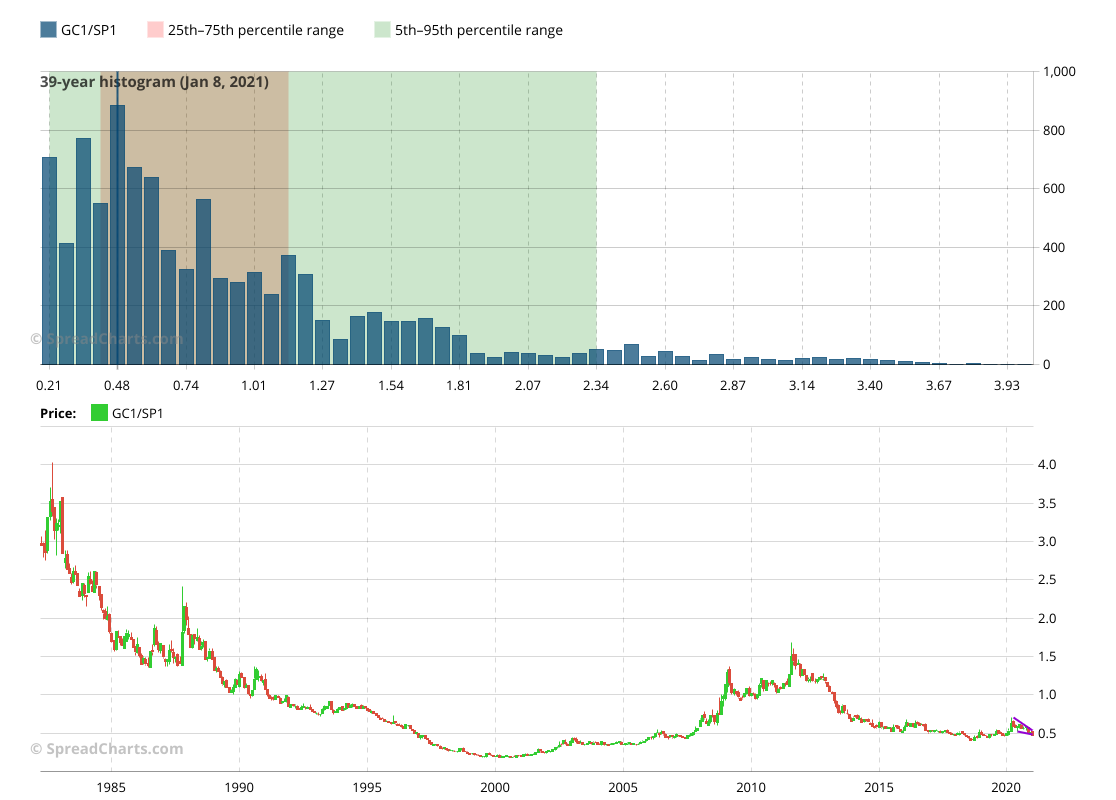
And if you really zoom out, you’d see how undervalued gold is compared to equities.
Speaking about intermarket ratios, it’s a good idea to look at the Swiss franc, which acts as a safe haven asset, just like gold. It’s been trending higher despite gold moving lower. The recent selloff was also much milder on the franc.

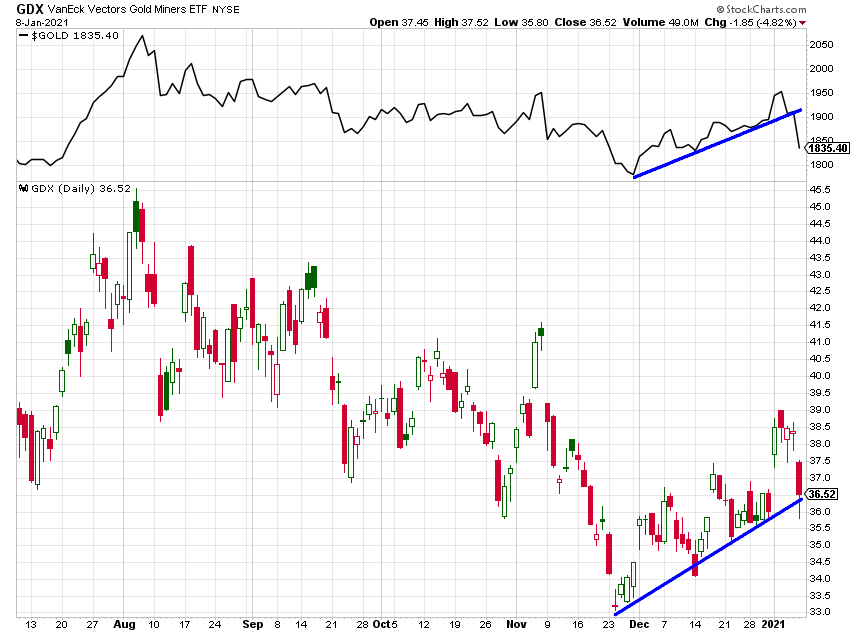
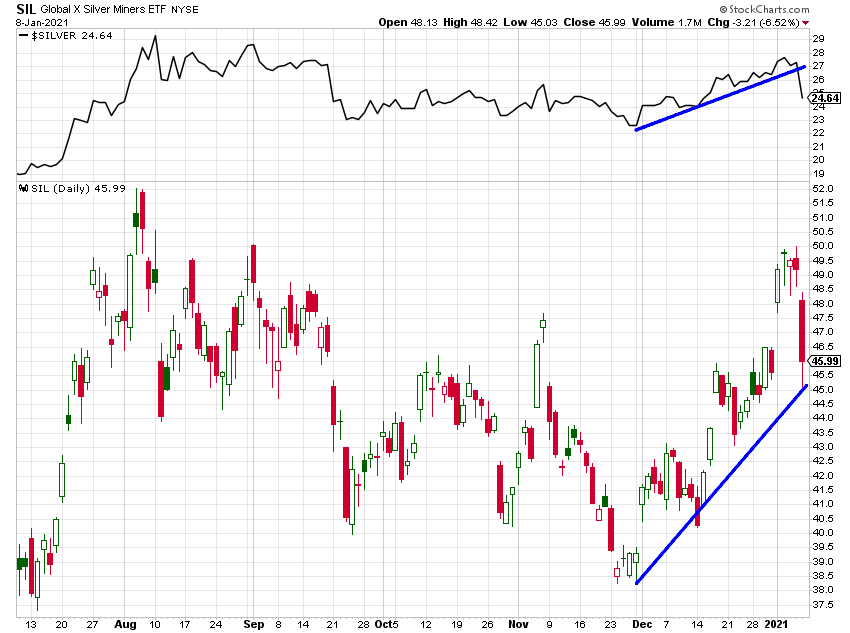
Let’s continue with the cross-market analysis, my favorite subject. Mining stocks usually move together with the metal itself. It’s higher beta makes them sometimes more sensitive to the market sentiment. And here’s the surprise. While gold and silver broke down, mining stocks never did. That quite unusual. Maybe they will just play catch up over the upcoming week. But maybe, they’re sending a signal.
Conclusion
Both bullish and bearish charts look convincing. Maybe it will be the US Dollar that will decide the fate of precious metals in the short term. It’s heavily oversold and close to support. Any reversal there might not be good for metals.
The problem is, it’s oversold and close to one support or the other since June last year…and it keeps going lower. Of course, there will be a bounce. But timing it is difficult, it may be weeks or even a few months away. The rising Treasury bond yields are not helping either, even though real yields are not moving much because of the rising inflation expectations.
Here’s our conclusion: We don’t know where gold will move in the short term. But we know what to watch for to get a clue. The recent price action is bearish. All the bullish arguments are sound, but many of them are hanging by a thread… especially the technical situation and the miners. For the bullish scenario to play out and gold to reach $2000 before $1680, we want to see a bullish price action soon, preferably over the next few days. No consolidation! The market may consolidate, but not here below $1850. That would be bearish.
So the bullish scenario depends on a quick rebound and maybe a short consolidation around $1900, anything less than that is probably bearish.
Nevertheless, our outlook can be subjective, and we’re under the influence of our emotions, as every other human being. If you’re interested in outlook without bias, we have to alert you to a recent valid signal on gold, generated by the artificial intelligence on SpreadCharts.
Signals and other great features are part of our premium subscription.
📈New trading signals📈 have been added to https://t.co/j2kBYXIYSv
We like signal on 🐄#Cattle🐄 and maybe the risky one on 🍫#Cocoa🍫. Don't forget to check the valid signal on 🪙#Gold🪙 and watch the weak signal on 🔥#NatGas🔥.#GC_F $GLD $GDX #NG_F $UNG #LE_F $COW #CC_F $NIB pic.twitter.com/VrLLBz2clR
— SpreadCharts.com (@SpreadChartsCom) January 9, 2021
Check out these great articles as well
New data: Rates and electricity
As promised, we’re adding new data to the SpreadCharts app. Importantly, the goal is not...
Read moreNew data: Sector indices
Our software is already established well beyond commodity market analysis. Stock indices, currencies, and even...
Read moreWhat’s new in the SpreadCharts app?
It’s been a few months since we launched the new version of the SpreadCharts app....
Read moreA major new version of the app is here
Today, we’re excited to show you the major new version of the SpreadCharts app that’s...
Read more