Natural gas: Our prediction is working!
Today we will focus on the natural gas market. At the times when many traders expected rocket growth, our market prediction has been different. And as it turned out, our prediction was right. Today, I will explain in more detail our point of view on the market and our strategy.
Natural gas price evolution
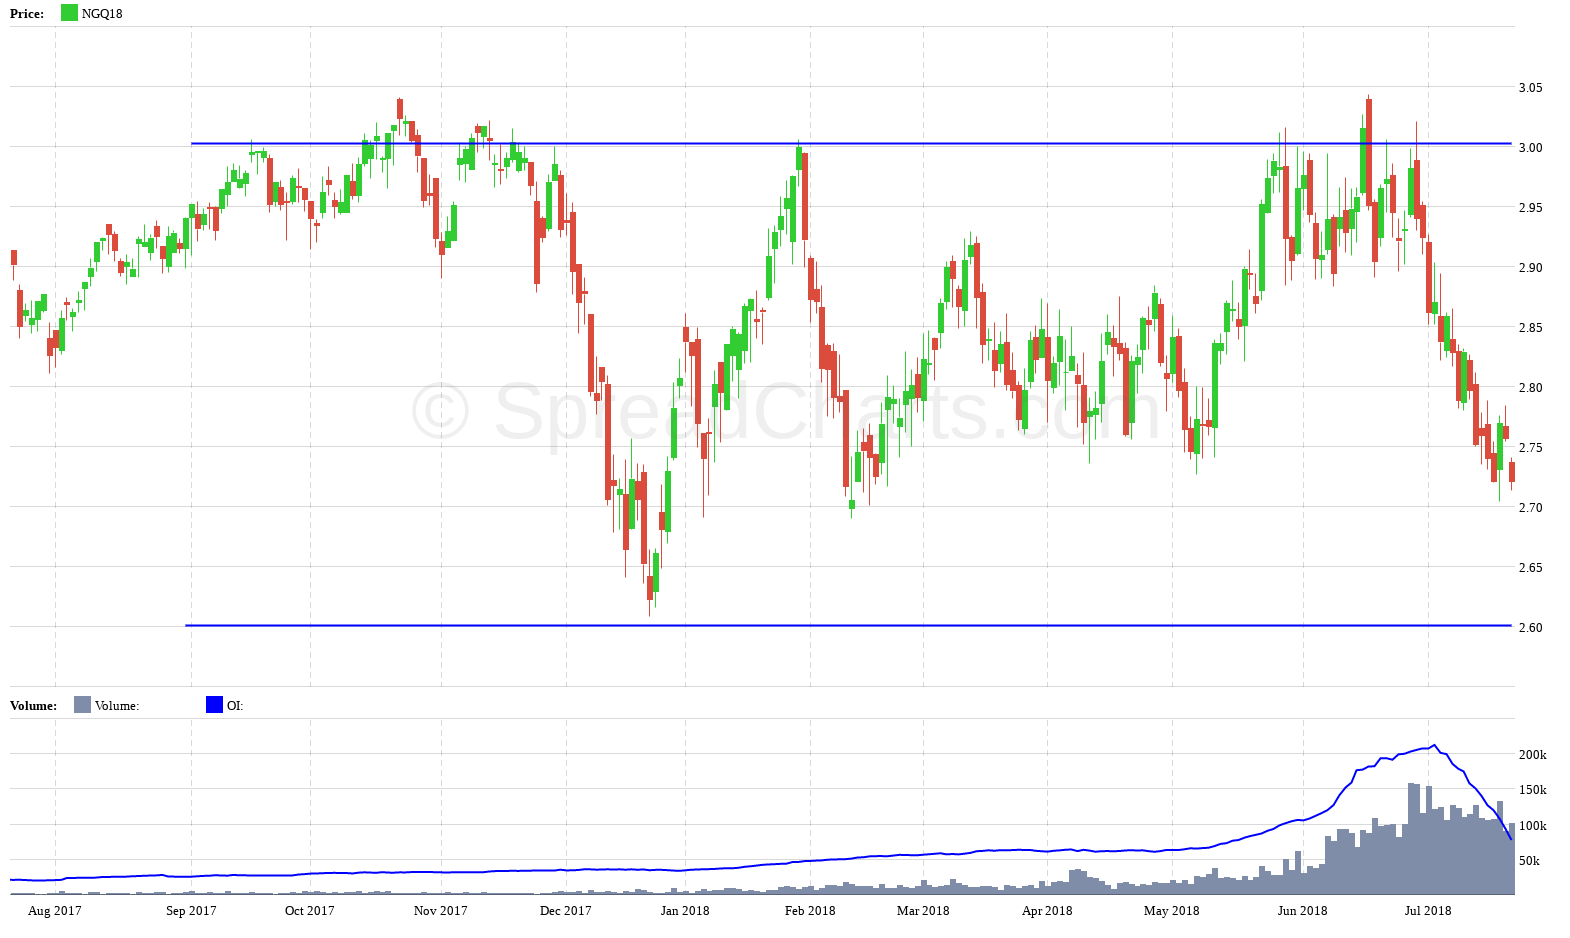
At the beginning of the year our prediction was: “NatGas price will move sideways in a broad trading range between $2.6 – $3.0“. We have consistently followed this outlook, which has been correct.
Since the end of June, the price of NatGas has come through a significant sell out. The price had climbed up to $3 and tested the resistance for several weeks. In the Spread reports we have mentioned many times that the only thing that kept gas at higher prices had been the warm weather in the US. This has led to an increased use of air conditioners, resulting in strong powerburn. When we add the stock deficiency after a strong winter, the only possible outcome could have been the rise in NatGas prices to $3.
But then the change has come. Meteorological models began to predict colder weather. Once the last reason for the high price has disappeared, the price took a dive as you can see on the chart. The price went down to $2.7. At this level there is a good chance for a bounce upwards. But we think that the natural gas is fairly valued right now. That is why we currently do not plan opening a long position.
Further price developments will be fully dependent on weather. If the weather changes again and the hot summer comes, the price is likely to rise and again test $3. In the case of normal or colder summer, however, it is quite possible that there will be a decline to another strong support around $2.60. We cannot even rule out a bigger drop to $2.50. Simply said, weather will be the main driving force behind the price of natural gas this summer.
It is important to mention another thing. While it is true that we are witnessing an inventory deficit and a summer season with an increased demand, the production remains very strong. The proof of this fact is that despite the almost perfect weather, the price has failed to overcome the strong resistance at $3. Therefore, we continue to keep our original prediction, i.e. the movement of the price to the side in a wide trading range, of course only until the winter. Then we will make a new prediction based on current fundamentals.
Short position
We currently hold a short position through a bear spread between the January and February contracts (NGF19-NGG19). Many traders unnecessarily delve into every new report on inventories, demand, etc. They are too concerned with the short-term noise and ignore long-term fundamentals. However, we consider our position to be a long-term one, where time plays an important role thanks to the contango. After the summer, the off-season will return with strong production, and contango will again have the main voice. That is why it will be enough for us if the gas price will move sideways in the upcoming months.
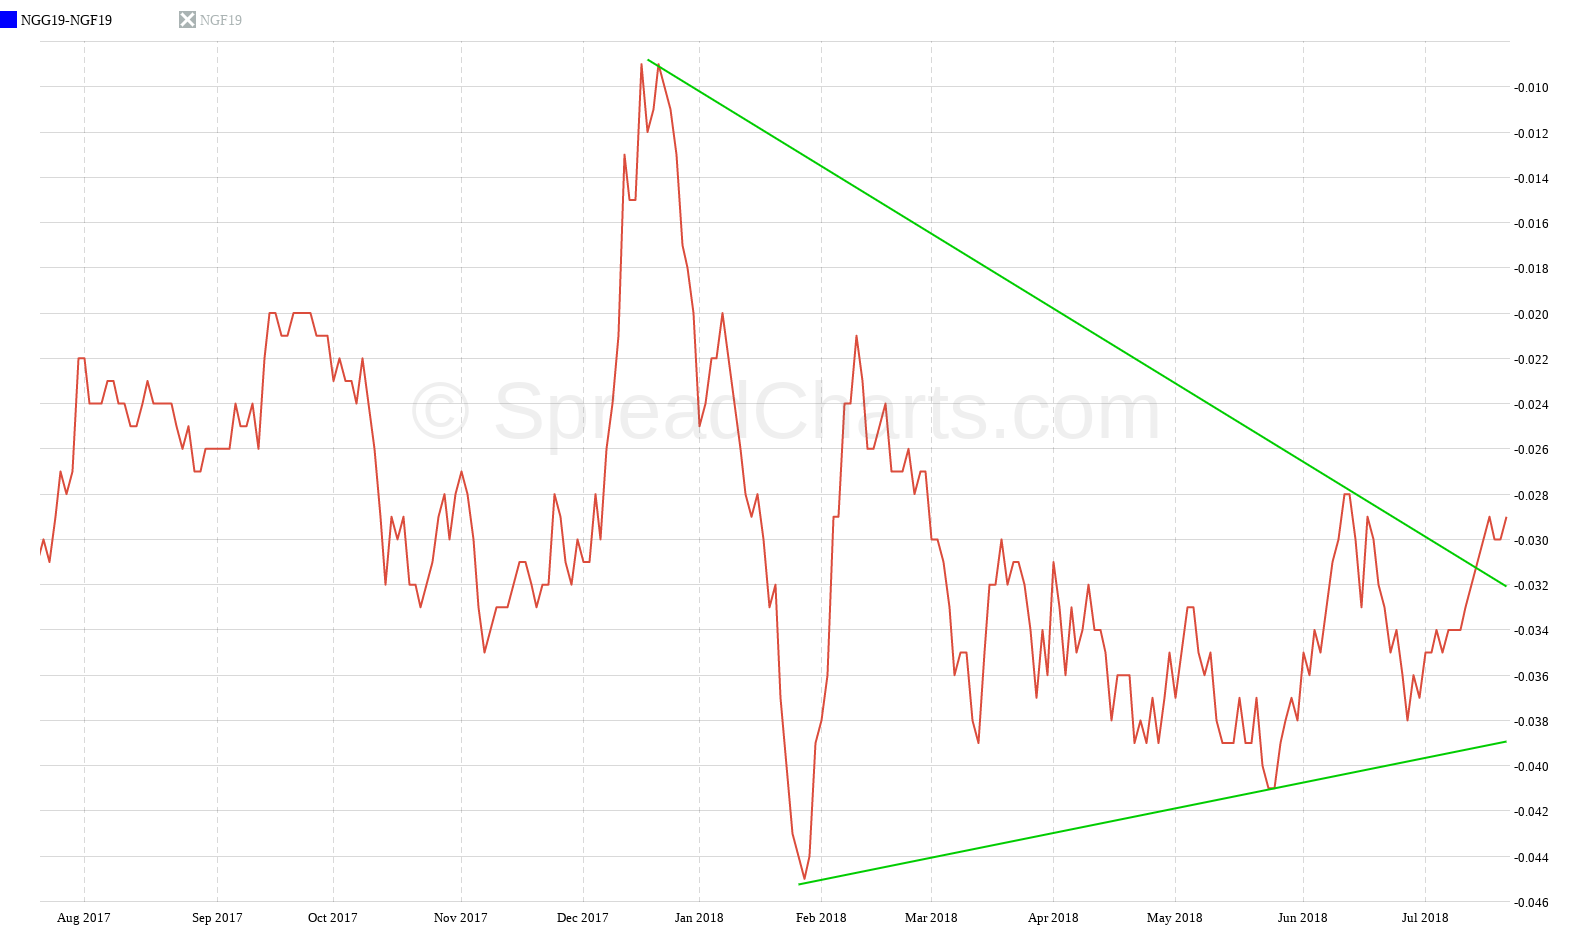
Bear spread is doing fine as expected, i.e. it moves slowly higher. The reason is the hot start of the summer and the storage deficit. These fundamentals hold the spread under pressure. But if there won´t be an abnormally hot summer, the deficit will begin to decline, which will be accompanied by increasing contango and rising bear spreads.
But as you can see in the following chart, we can now see a positive signal. The spread broke the symmetrical triangle pattern. This still does not have to be definitive. In any case, we consider it to be favorable at least in the short term.
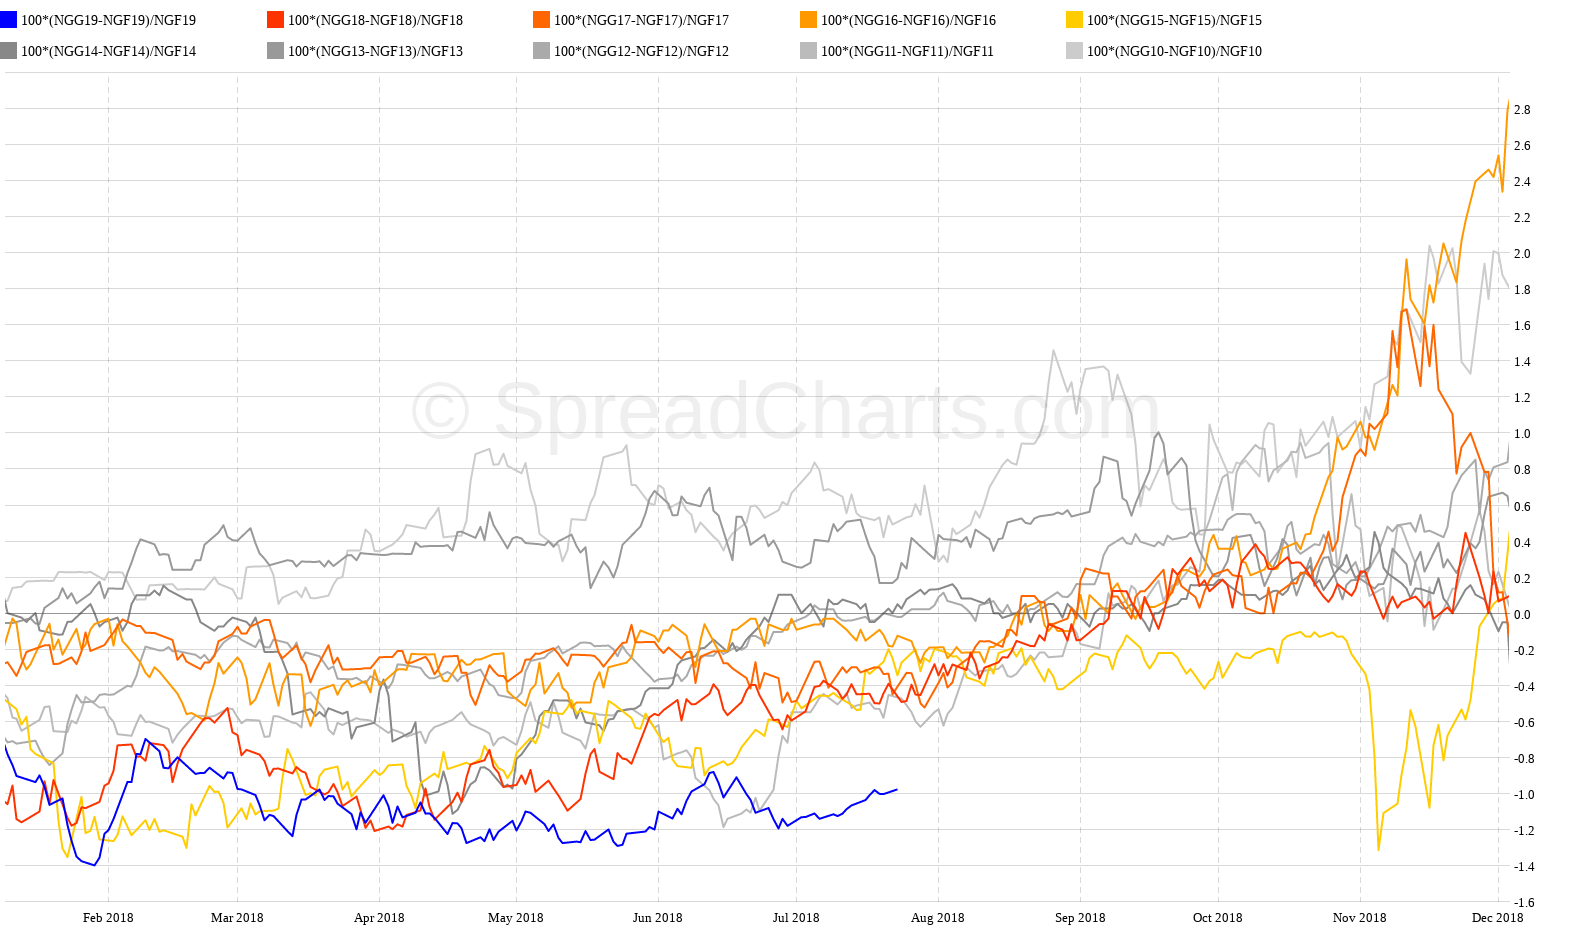
Another very interesting thing is the visualization of the contango percentage between given expirations. Specifically, I mean a detailed seasonality chart. In comparison to previous years, it is obvious that the current contango is extremely low. Therefore, there is a good chance that the market will try to return to a more normal state. In addition, this spread seems to go higher in the upcoming period.
As it has been already said today, everything depends mainly on the weather which is hard to predict. Anything can happen. In the case of hot summer, it is possible that the bear spread will remain under pressure and will even fall. Notice the yellow curve on the previous chart (from 2015). The spread remained in the long-term backwardation back then and moved roughly sideways. Near the expiration it even fell sharply. It is therefore necessary to count with every scenario and adapt to it. We hold an appropriately sized position and if the trade does not work out, it won’t be a problem for us.
Long position
Yes, we also think about a long position. In essence, it would serve as a hedge against our current short position. However, we will consider this opposite position only if the natural gas price would continue to fall. Then it would likely become undervalued and a potential long position would make much more sense.
Do not miss our next analysis.
Check out these great articles as well
New data: Sector indices
Our software is already established well beyond commodity market analysis. Stock indices, currencies, and even...
Read moreWhat’s new in the SpreadCharts app?
It’s been a few months since we launched the new version of the SpreadCharts app....
Read moreA major new version of the app is here
Today, we’re excited to show you the major new version of the SpreadCharts app that’s...
Read moreLiberation Day!
Tariffs are arguably the dumbest part of Trump’s agenda. Yes, the goal makes perfect sense,...
Read more

