New data: Indices
We continue adding new data to the SpreadCharts app. This time for indices. Although we’re focused primarily on commodities, understanding the broader market is essential for every trader or investor.
The new contracts are listed below:
- ICE MSCI Emerging Markets Index
- ICE MSCI EAFE Index
- CME E-mini Russell 1000
- CME Nikkei/Yen
- CBOT Bloomberg Commodity Index
You can find them in the SpreadCharts app under the Indices group.
How can this data be useful for commodity traders? I’ll include three interesting examples.
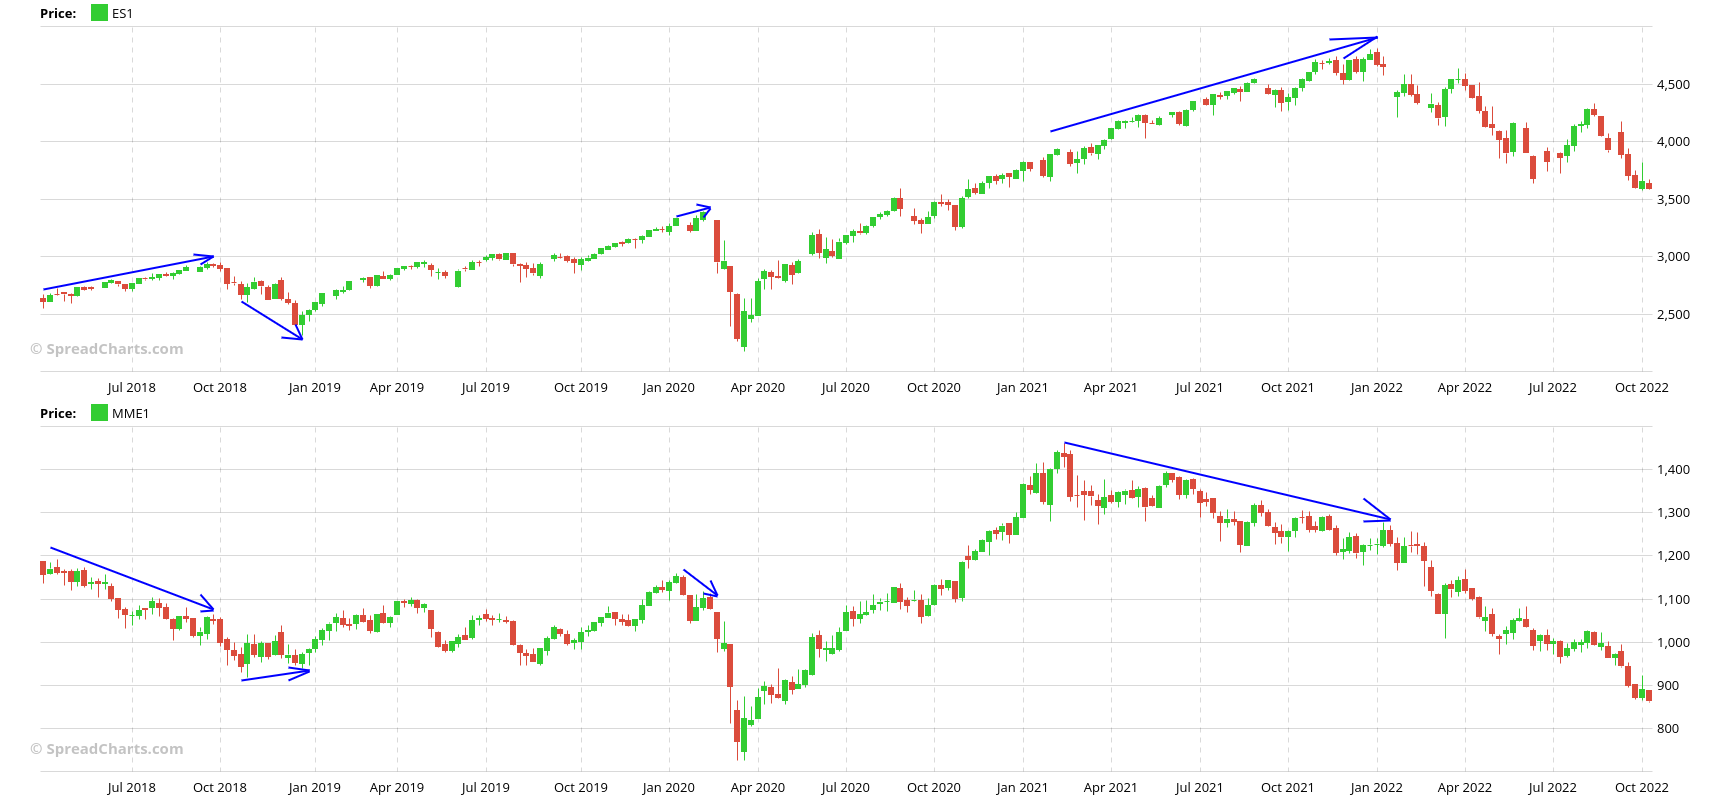
Crises began in Asia
Emerging markets have become more important than ever before. The catalyst was the rise of China. Sure, the USA is still the largest global economy. However, China is the world’s largest consumer of most commodities.
Nearly all of the crises since 2015 either originated or became felt first in emerging markets. Sounds dubious? Well, look at the ICE MSCI Emerging Markets Index (bottom) compared to S&P 500 (top). While US stocks were making higher highs, emerging market stocks were already selling off. And the US market eventually rolled over too.
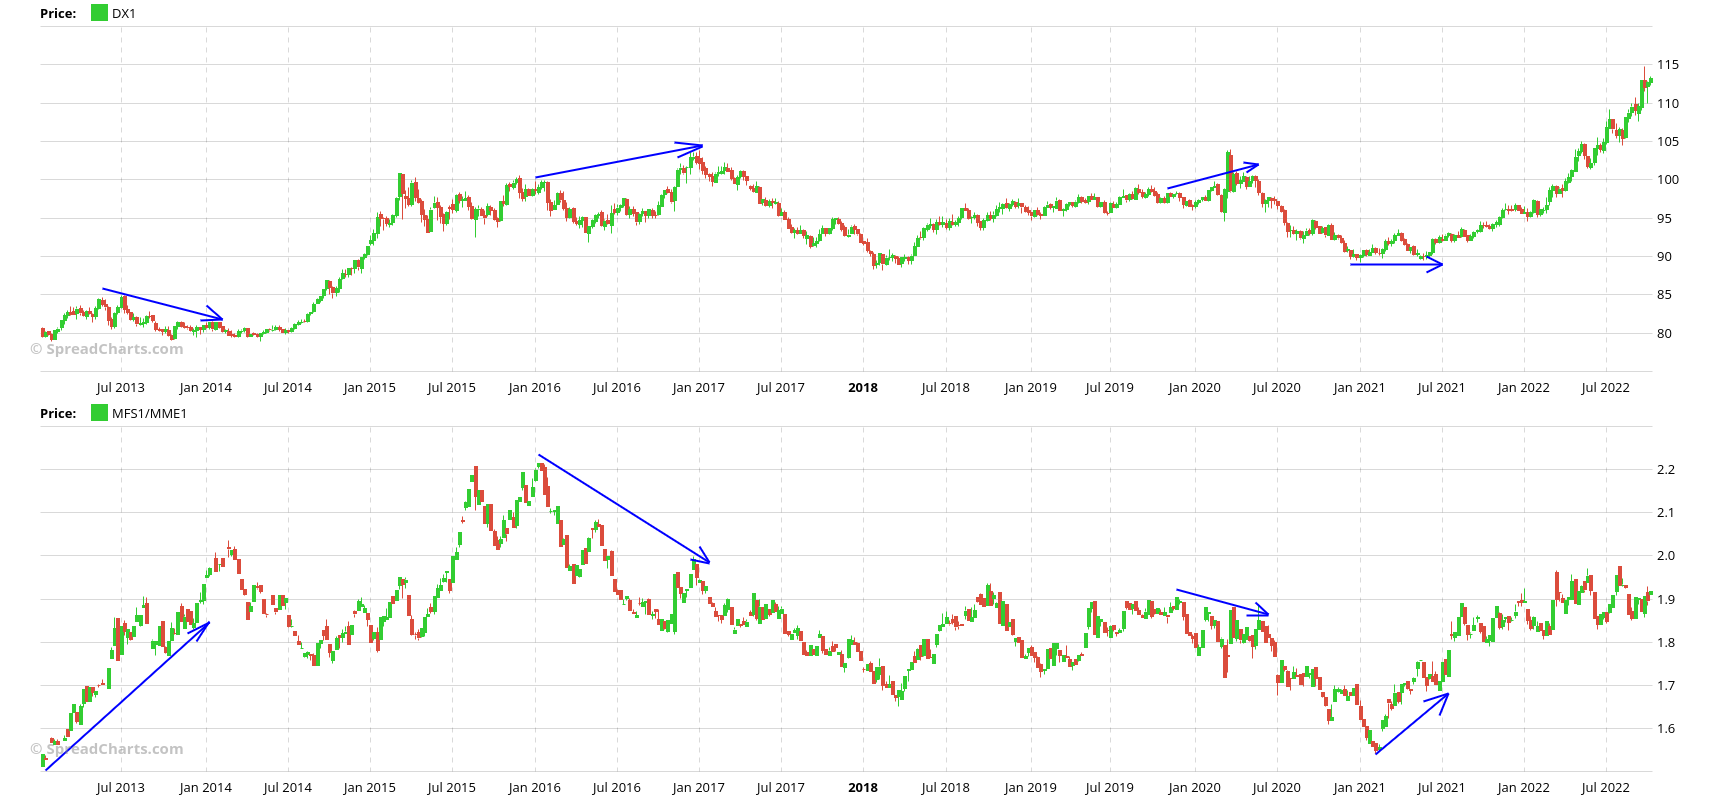
Leading indicator for the US Dollar
The second use case is the EAFE/EM ratio. I often use it as one of the leading indicators for the US Dollar. The idea is that reversals in equity flows between developed and emerging markets often precede reversals in currencies. Of course, you can spot situations where it failed, but nothing is 100% reliable in the markets. But it definitely makes sense to use this ratio as part of a larger analytical framework.
Sentiment data
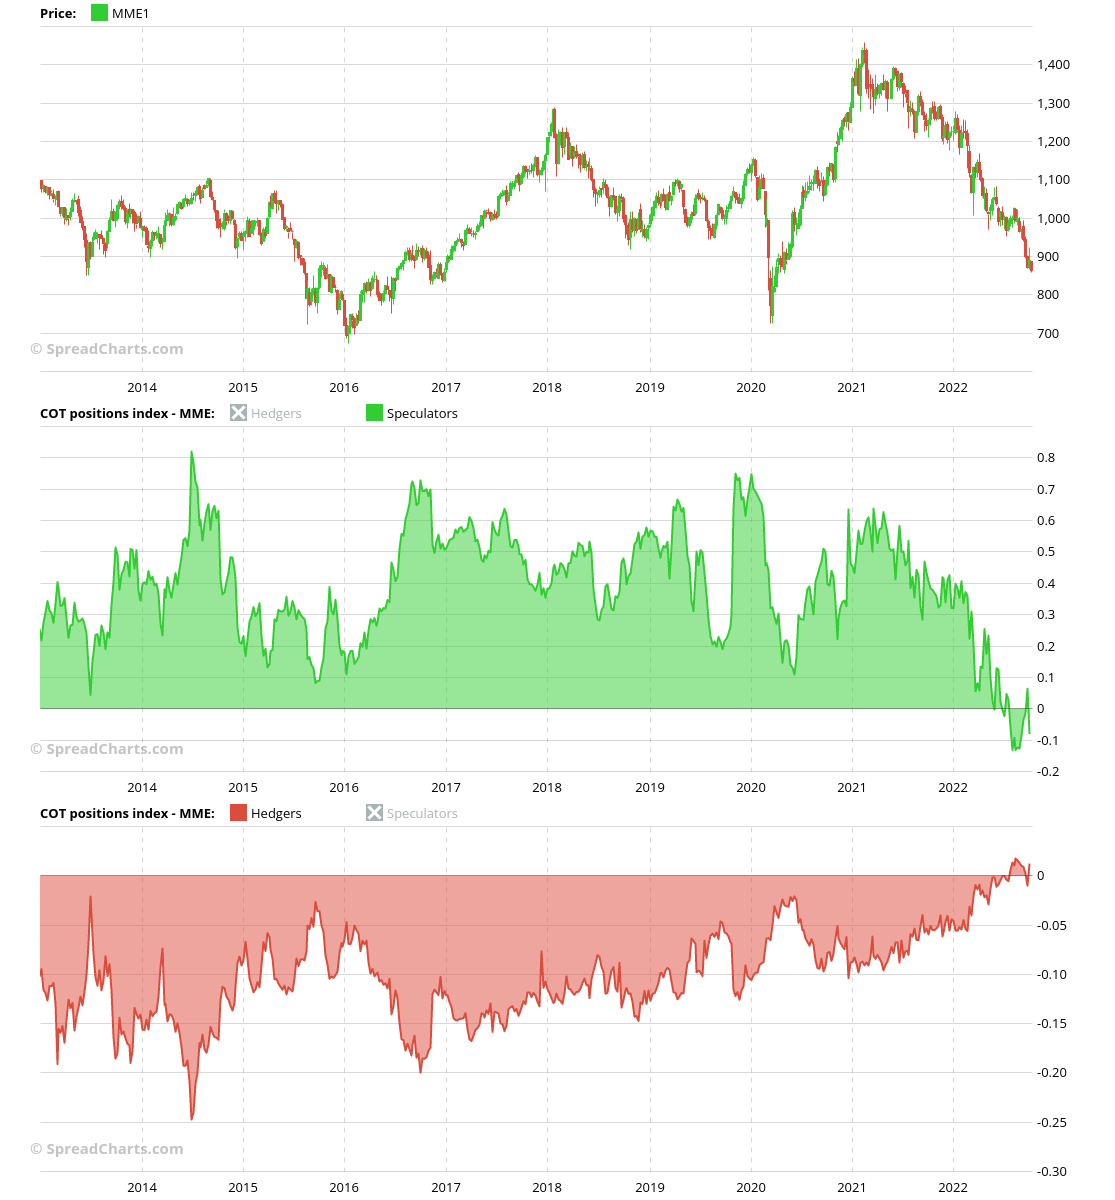
Previously, I used the EEM ETF for visualizing emerging market stocks. But this ETF pays a dividend, and using it in ratios with other ETFs with different payout dates can result in major distortions in the data. The ICE EM and EAFE futures do not suffer from this problem.
Moreover, we have the Commitments of Traders data for these EM/EAFE ICE indices in the SpreadCharts app. That is perfect for analyzing sentiment in these markets. For example, the EM stocks are incredibly oversold, according to the COT data.
You can browse the new data right now in the SpreadCharts app, either in the free or the premium version. Just don’t forget to fetch the new version using Ctrl+Shift+R.
Check out these great articles as well
New data: Rates and electricity
As promised, we’re adding new data to the SpreadCharts app. Importantly, the goal is not...
Read moreNew data: Sector indices
Our software is already established well beyond commodity market analysis. Stock indices, currencies, and even...
Read moreWhat’s new in the SpreadCharts app?
It’s been a few months since we launched the new version of the SpreadCharts app....
Read moreA major new version of the app is here
Today, we’re excited to show you the major new version of the SpreadCharts app that’s...
Read more