Profit/Loss calculator
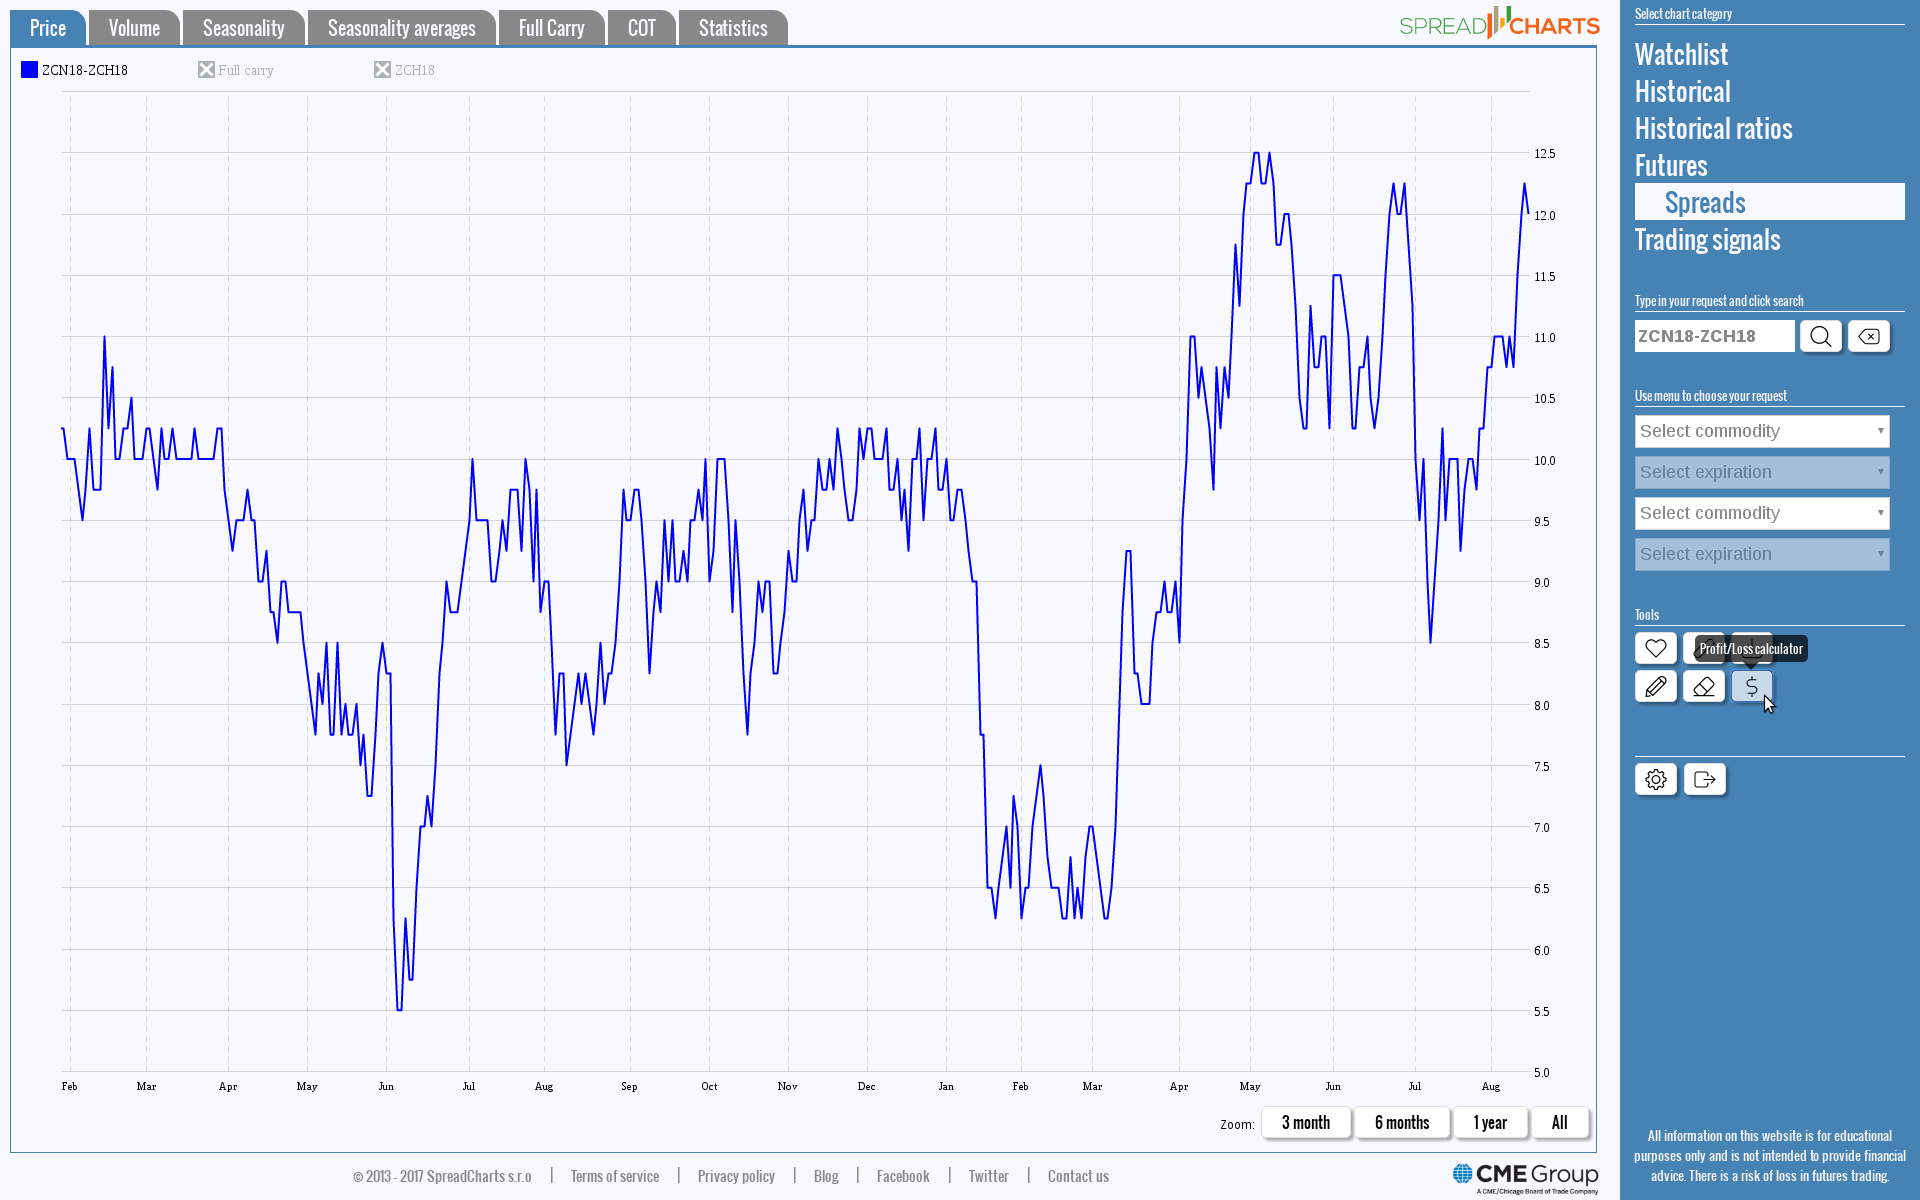
We made some layout changes in the app. Wide buttons in the control panel (on the right) were replaced by slick icons. When you hover over an icon, you’ll see a bubble with description.
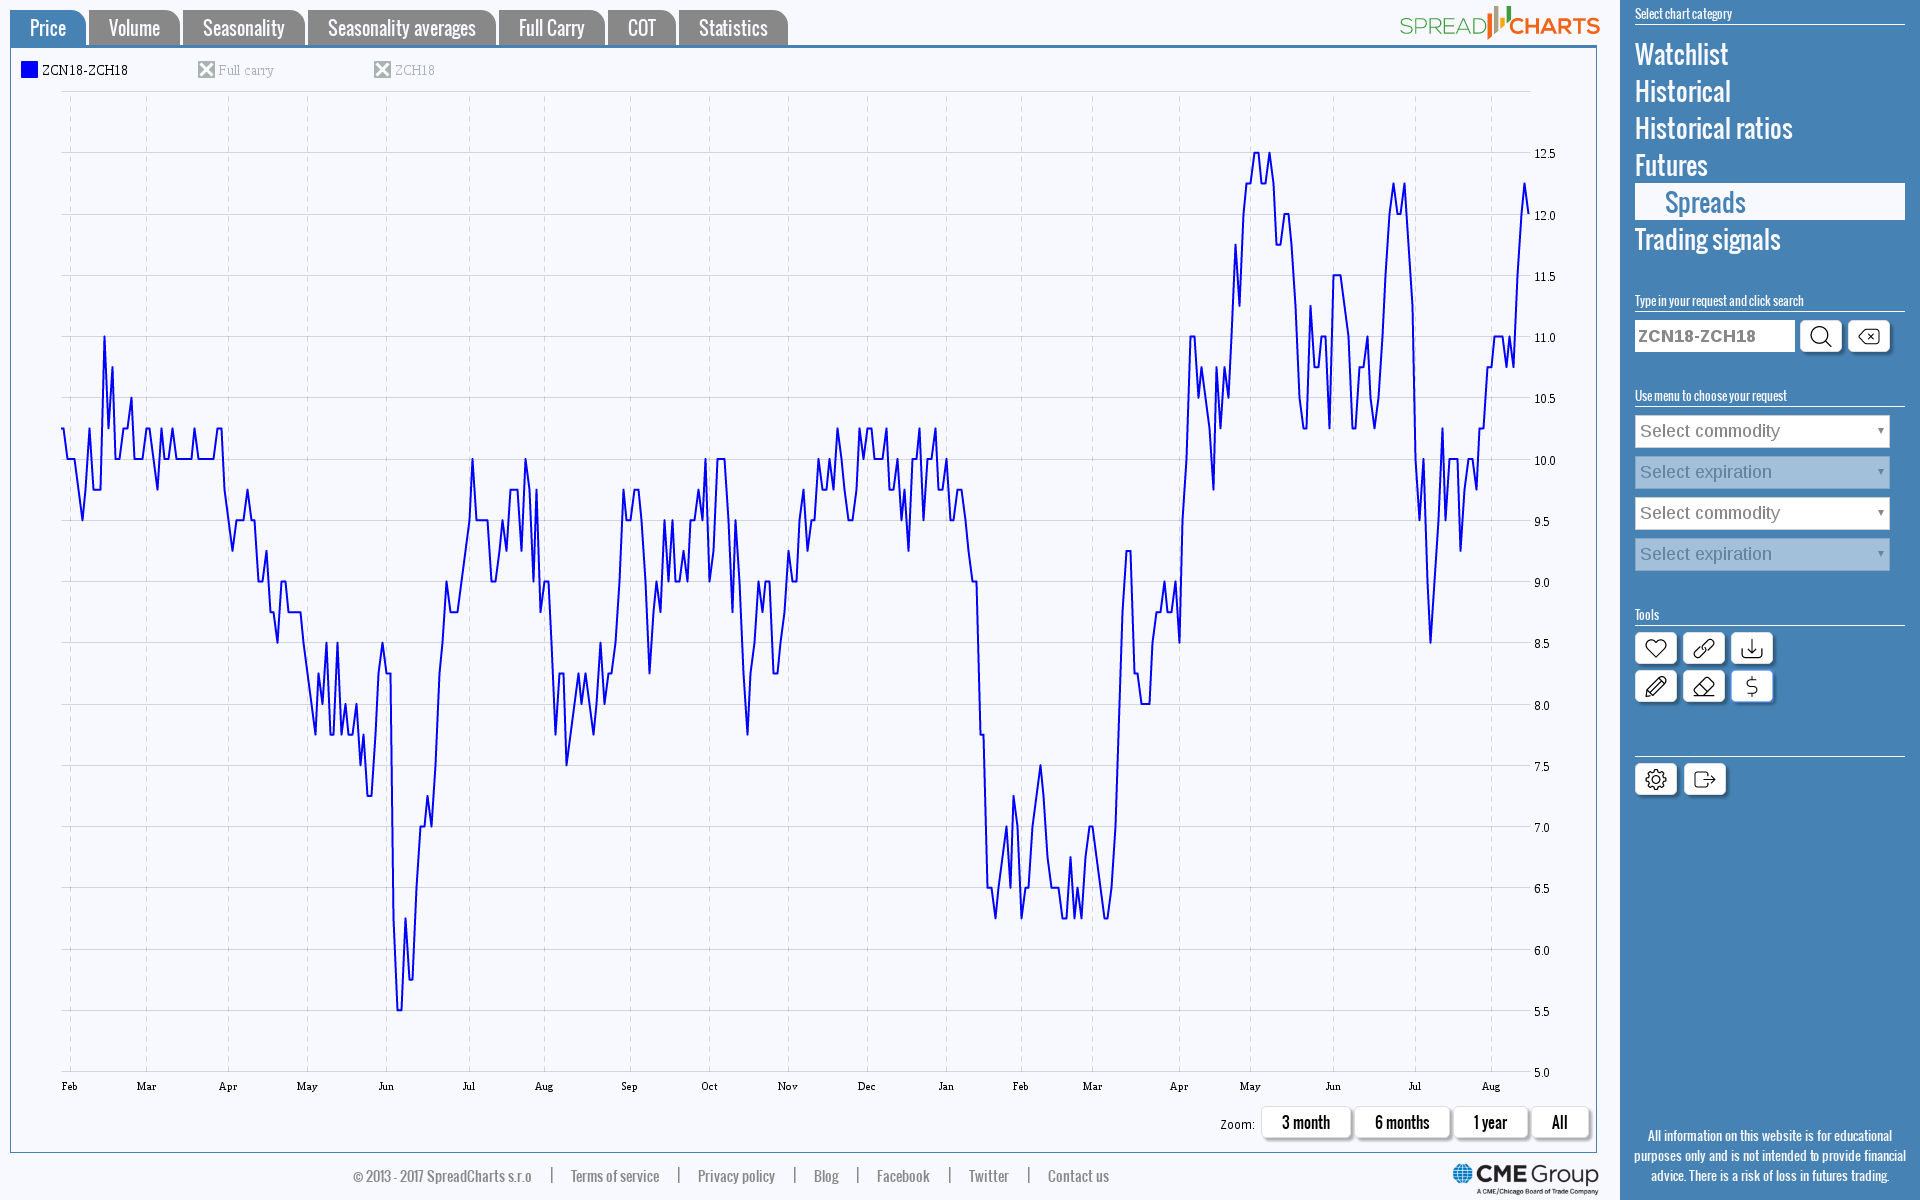
We also implemented a profit/loss calculator. You can seamlessly display theoretical profit or loss right in the chart of a spread or future. Start by activating the Profit/Loss calculator (the $ icon).
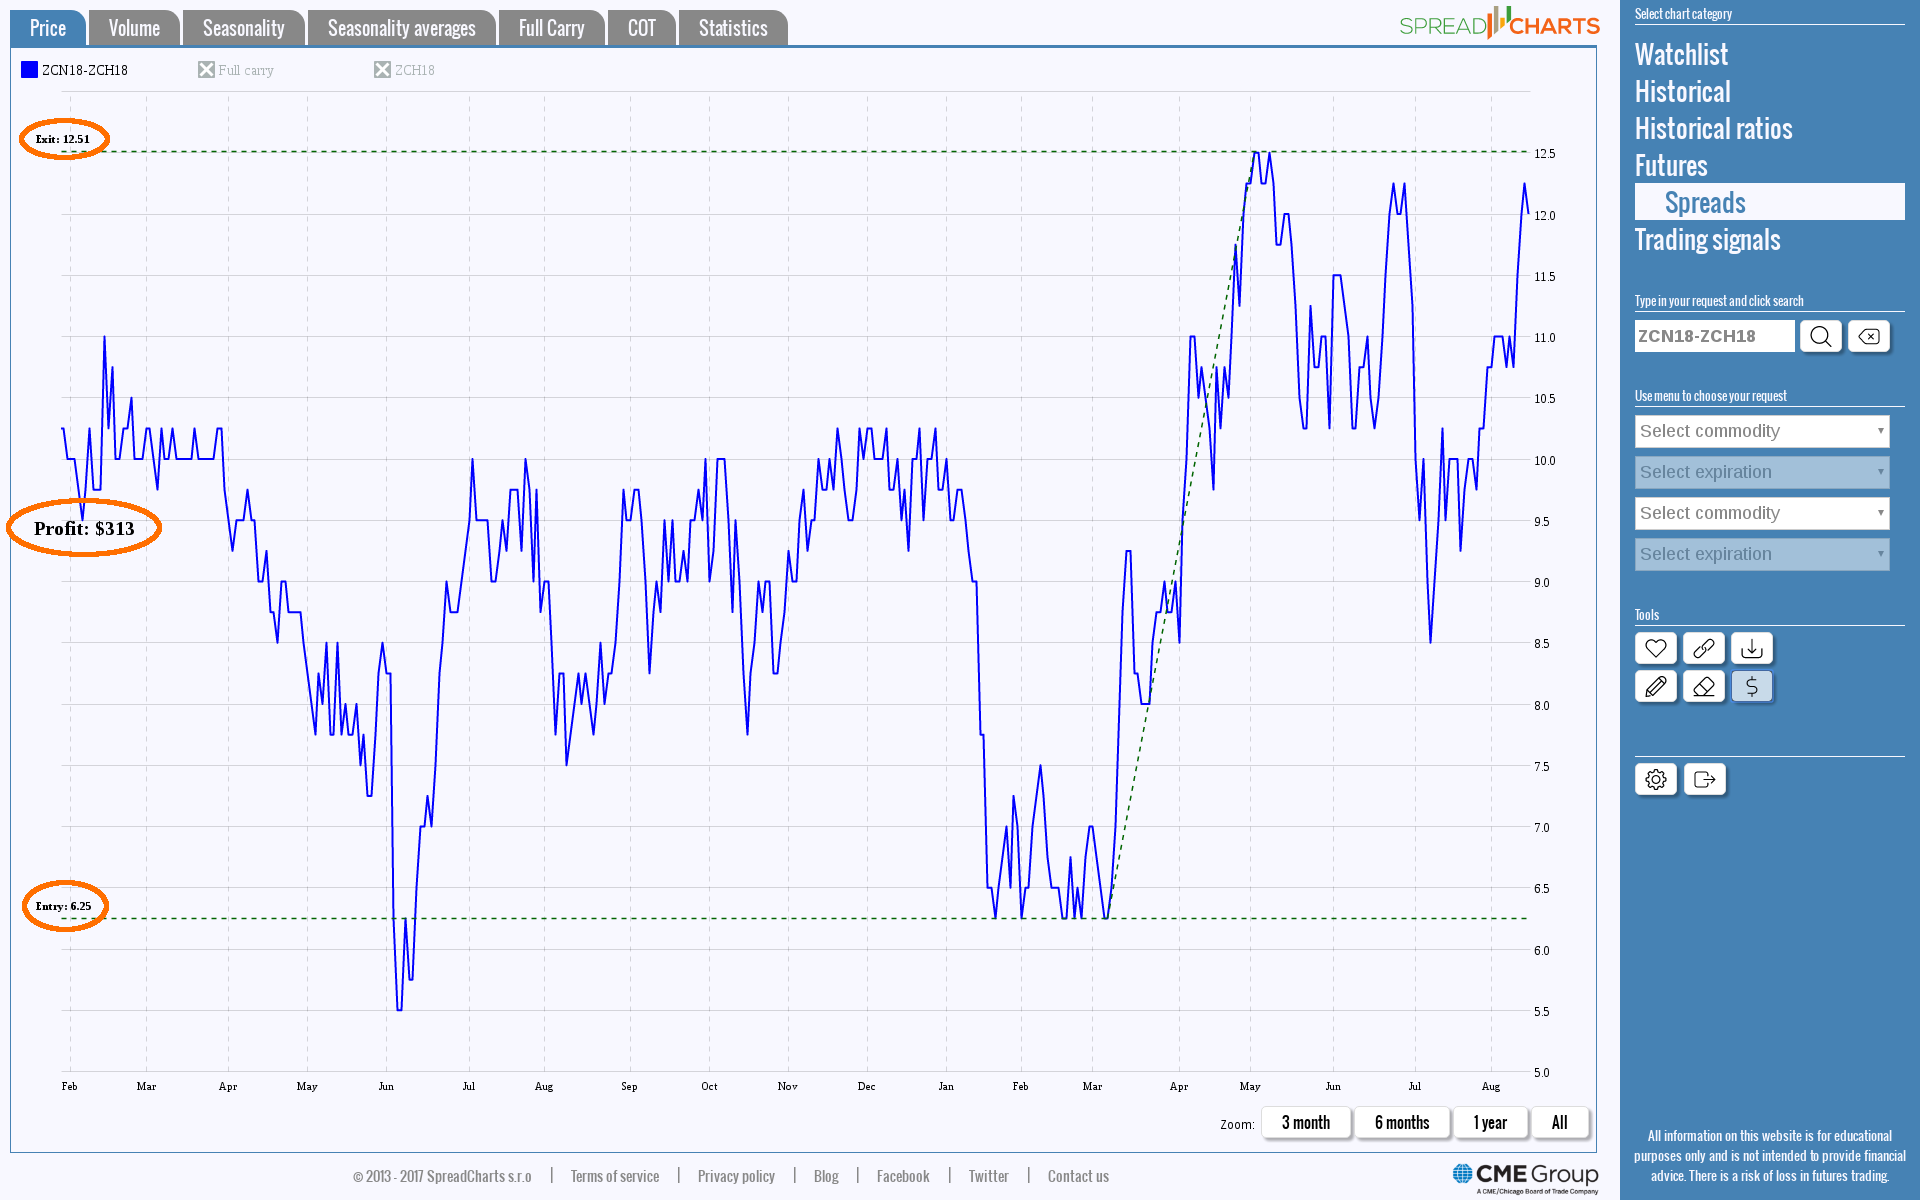
Then draw an arbitrary line in the chart (red)…for instance from previous local low to local high.

The calculated profit or loss is highlighted on the left, together with selecter entry and exit price.
Check out these great articles as well
New data: Rates and electricity
As promised, we’re adding new data to the SpreadCharts app. Importantly, the goal is not...
Read moreNew data: Sector indices
Our software is already established well beyond commodity market analysis. Stock indices, currencies, and even...
Read moreWhat’s new in the SpreadCharts app?
It’s been a few months since we launched the new version of the SpreadCharts app....
Read moreA major new version of the app is here
Today, we’re excited to show you the major new version of the SpreadCharts app that’s...
Read more