Seasonal trading signals launched!
After about a year of development, we’re launching our new seasonal trading signals. The studies are based on our own algorithm, which was tweaked to find the best trades in the futures markets. Actual trades are sorted by the entry date. Each row contains the computed entry and exit date from the trade, average return on investment in the last 5 or 15 years, and the maximum drawdown during the respective period.
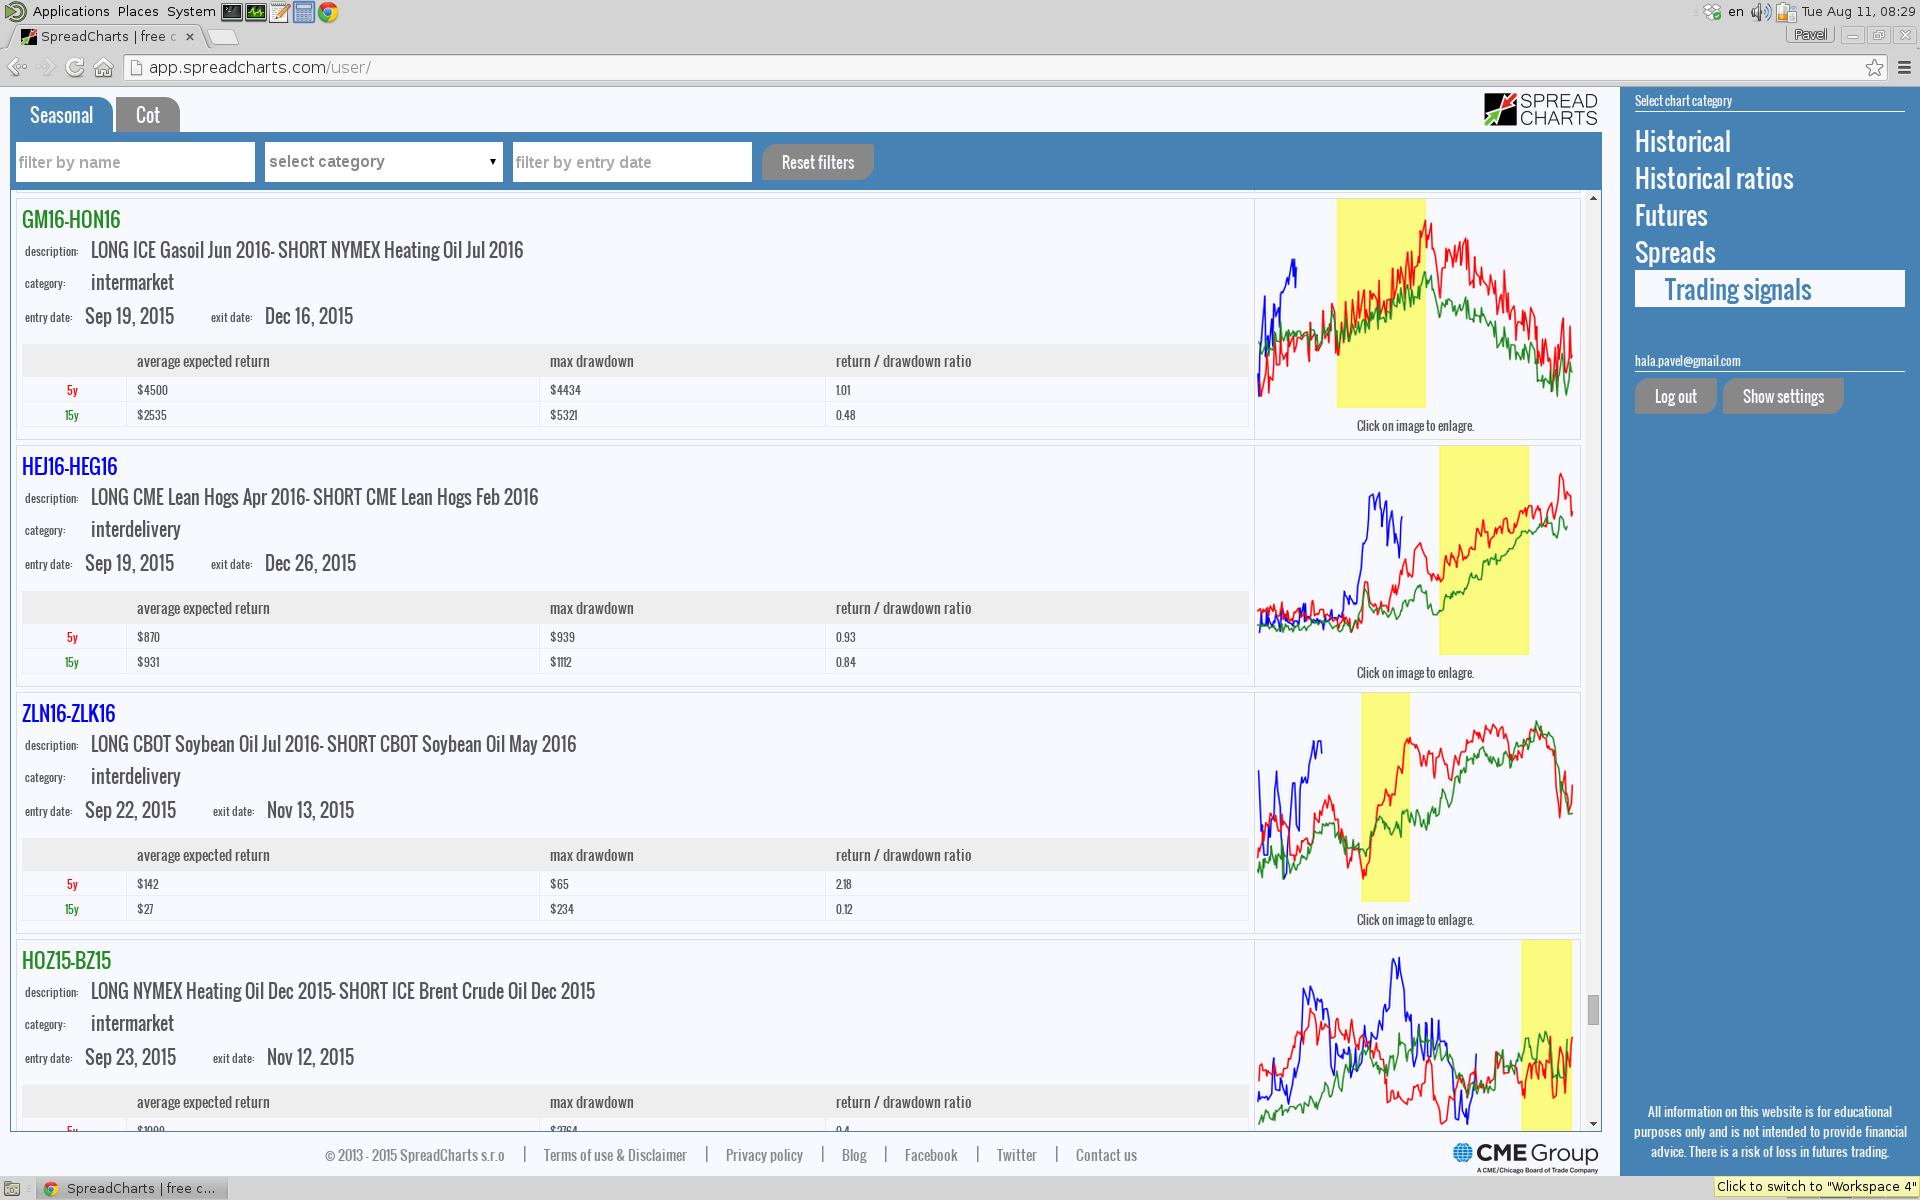
That’s not all. There are a few cool features. First, when you click on the ticker of the spread or futures (e.g. HEJ16-HEG16), the app will open the “Seasonality” tab in the “Spreads” section and display the selected trade. You can analyze the trade and then click on “Trading signals” section to go back.
Another feature is enlarging the chart. When you click on an image of the chart on the right, the bigger interactive version of the chart rolls out below. You can use it to thoroughly analyze the expected movement of the spread or future.
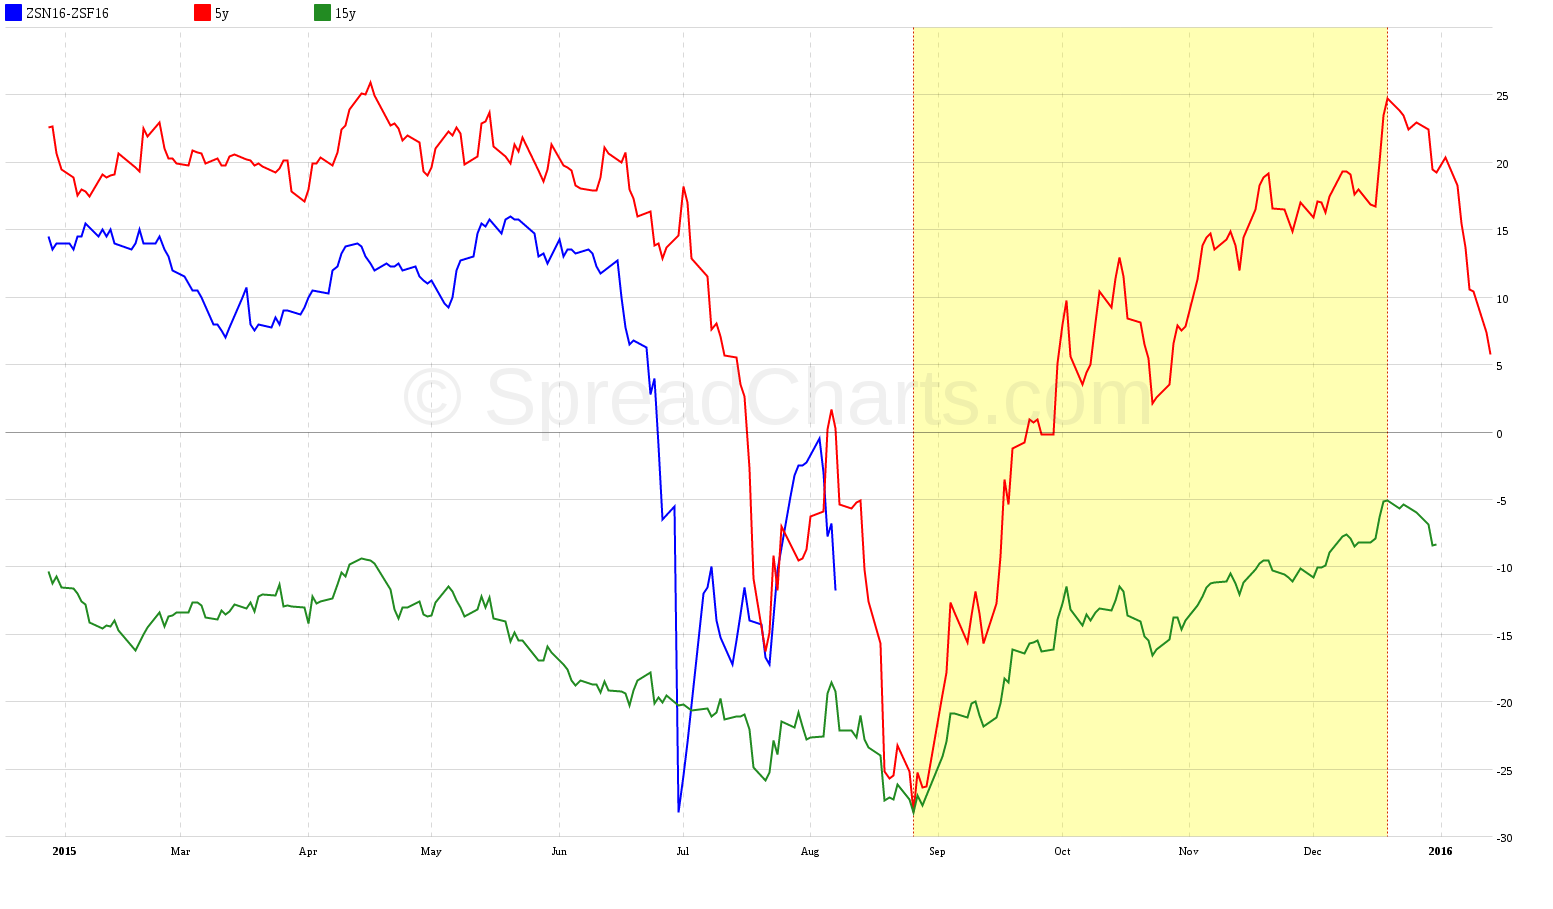
Every chart can be exported as a png image by clicking on the button below the chart and then saving the displayed image. We hope you enjoy these great new features in our app. The app remains free for personal use.
As with all of our other charts and studies, trading signals are intended for educational use only and we strongly discourage anyone from making a trading decision based on any chart or information on our website.
Seasonal trading signals are computer generated time series and are not intended for actual trading. Seasonal or any other trading signals are intended only for educational purposes. SpreadCharts s.r.o. (the company) or its representatives bear no responsibility for actions taken under influence of seasonal signals or any other information published anywhere on this webpage or its sub-domains. There is a risk of substantial loss in futures trading.
CFTC rule 4.41: Hypothetical or simulated performance results have certain limitations. Unlike an actual performance record, simulated results do not represent actual trading. Also, since the trades have not been executed, the results may have under-or-over compensated for the impact, if any, of certain market factors, such as lack of liquidity. Simulated trading programs in general are also subject to the fact that they are designed with the benefit of hindsight. No representation is being made that any account will or is likely to achieve profit or losses similar to those shown. All information on this website is for educational purposes only and is not intended to provide financial advice. Any statements about profits or income, expressed or implied, do not represent a guarantee. Your actual trading may result in losses as no trading system is guaranteed. You accept full responsibilities for your actions, trades, profit or loss, and agree to hold SpreadCharts s.r.o. (the company) and any authorized distributors of this information harmless in any and all ways.
Check out these great articles as well
New data: Rates and electricity
As promised, we’re adding new data to the SpreadCharts app. Importantly, the goal is not...
Read moreNew data: Sector indices
Our software is already established well beyond commodity market analysis. Stock indices, currencies, and even...
Read moreWhat’s new in the SpreadCharts app?
It’s been a few months since we launched the new version of the SpreadCharts app....
Read moreA major new version of the app is here
Today, we’re excited to show you the major new version of the SpreadCharts app that’s...
Read more