We warned you
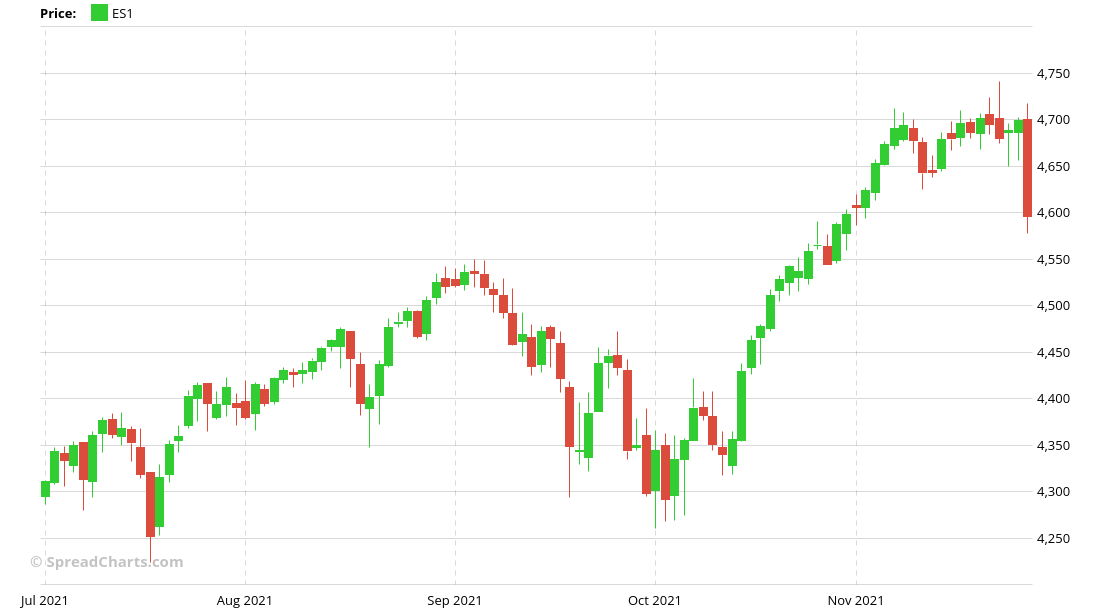
The stock markets around the world tanked on Friday due to the new SARS-CoV-2 Omicron variant spreading from South Africa, threatening to shut down the global economy again.
But you were lucky. You avoided the selloff thanks to our warnings.
We warned you the 1st time on November 7th.
The $VIX and its term structure suggest a pause in the strong $SPX uptrend in the near term.#ES_F $SPY #NQ_F $QQQ $IWM $VXX $UVXY $SVXY pic.twitter.com/Qfqfbw4qB6
— SpreadCharts.com (@SpreadChartsCom) November 7, 2021
Then we warned you the 2nd time on November 11th.
All the indicators continue to look bad. The most likely path for $SPX is lower for now.
We want to see backwardation on $VIX futures!#ES_F $SPY #NQ_F $QQQ $IWM $VXX $UVXY $SVXY pic.twitter.com/P2QFLLb71m
— SpreadCharts.com (@SpreadChartsCom) November 11, 2021
And finally, we warned you the 3rd time on November 16th.
Pretty constructive price action on $SPX as the market has closed near the all-time high.
Does that mean the market internals have improved?
The answer is simple: NO.
The market remains incredibly weak!#ES_F $SPY #NQ_F $QQQ $IWM $VXX $UVXY $SVXY https://t.co/zvu1eo1VyN
— SpreadCharts.com (@SpreadChartsCom) November 16, 2021
Well, how could we know that? There are only two possibilities:
A) Our crystal ball told us a new corona virus variant will emerge.
B) The new corona virus variant was just a random trigger, and the market would sell off anyway.
Of course, the B is correct.
Timing the top on equities is incredibly hard. While the bottom is usually an event, the top is often a process that takes some time. However, what is not as hard is identifying the times when risk is high and adapting accordingly. And this time, the risk was sky-high.
What was the red flag?
I use a simple Bayesian model aggregating various types of data. And I don’t remember the time the readings were so bad. Or actually, I do.
Here’s just some of the data I look at. The volatility was the first one to flash a warning, as it usually does. Check it out in our first warning.
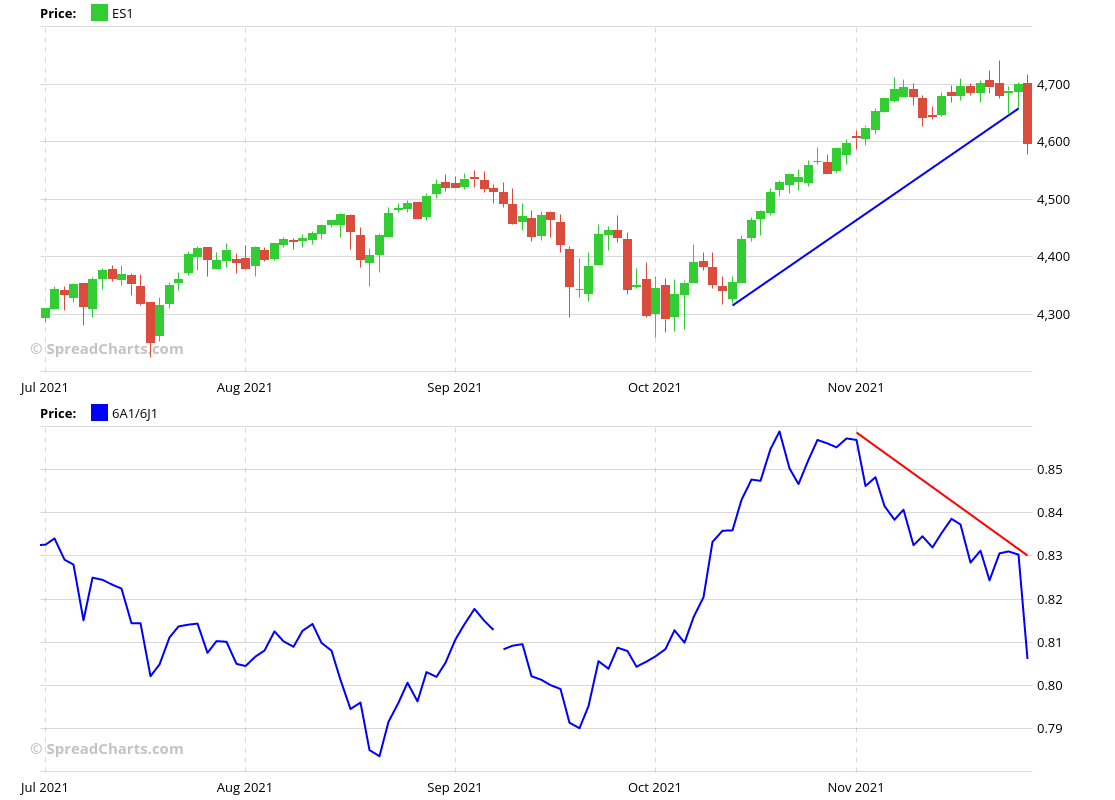
But the currency markets joined it soon after. For example, here’s the cyclically sensitive AUD/JPY ratio. Mind the divergence.
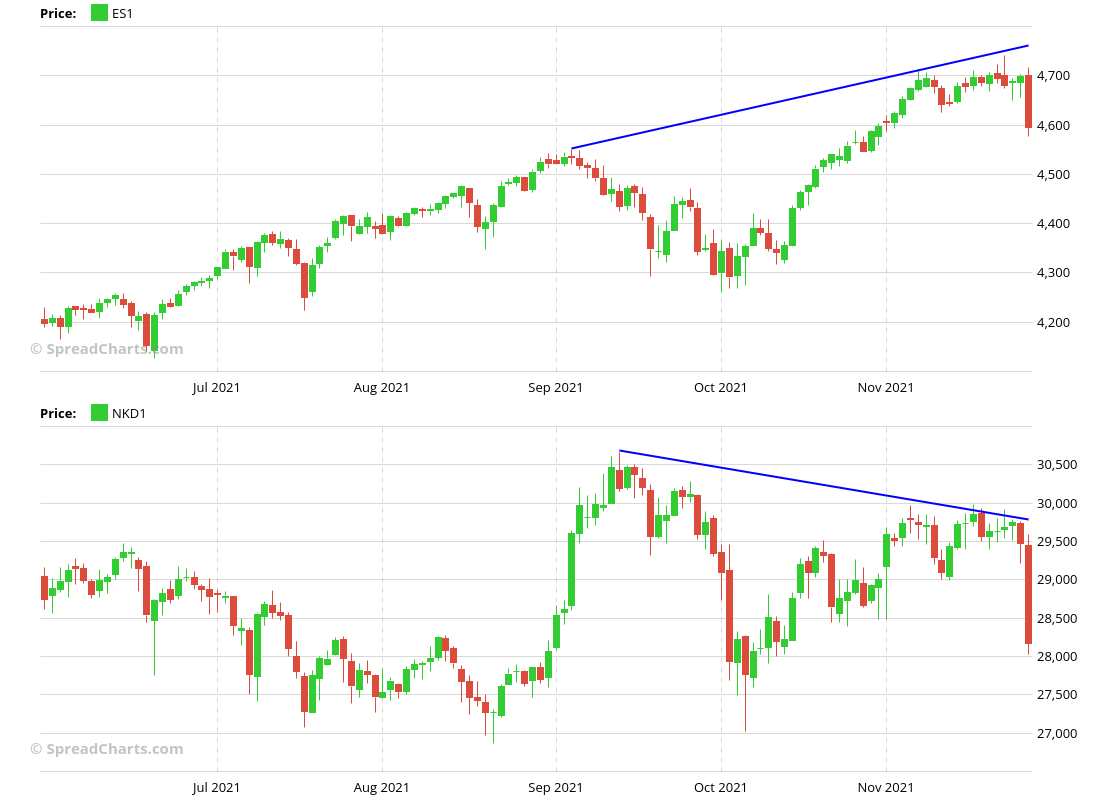
In more of a medium-term, the Nikkei diverged with the S&P 500 and acted weak right before the selloff.
And the US Dollar rallied hard, which historically led to major stock market corrections.
I can continue with the bond market, options market, energy markets, etc. It was astonishing how widespread the weakness was.
What comes next?
But right now, you’d likely want to know what comes next. First of all, it’s too premature to make any conclusions as we have just one day worth of data for this correction.
So I will just summarize the facts we know right now, and it’s up to you to make your own conclusion.
1) My model turned sharply from being incredibly bearish to neutral over a single day. That means the easy money has been made in the very short term (for bears), and we may get some kind of consolidation or a bounce higher over the next few days.
2) By looking around twitter, it seems everyone’s bullish. Or at least, no one’s really bearish. So there was not a proper sentiment reset yet.
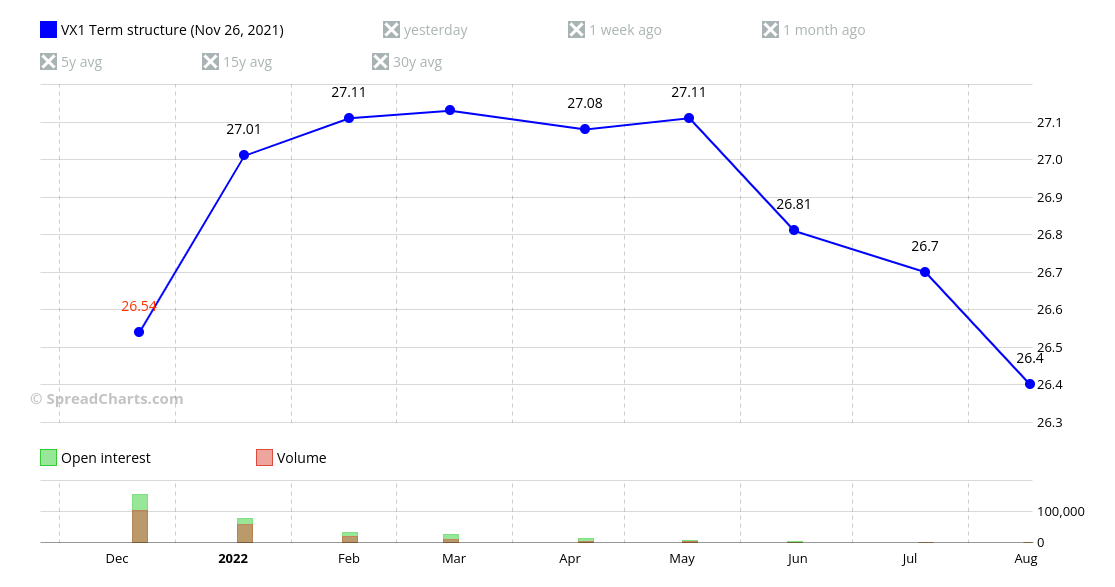
3) In one of our warnings above, we wanted to see backwardation on the VIX. While the back and the mid of the curve flipped into backwardation on Friday, the front remains in contango. This is in line with the previous point. While there was some real panic on Friday, we have not seen THE panic yet.
I will wait for more data and observe how they evolve, especially if we get a bounce. It’s better to be somewhat late than too early, as I used to say. But this is the approach that works for me. We’re not recommending anything to anybody.
I stated the facts, so use them to your advantage. If the data changes, we will keep you updated on our twitter or do a video analysis.
Check out these great articles as well
New data: Sector indices
Our software is already established well beyond commodity market analysis. Stock indices, currencies, and even...
Read moreWhat’s new in the SpreadCharts app?
It’s been a few months since we launched the new version of the SpreadCharts app....
Read moreA major new version of the app is here
Today, we’re excited to show you the major new version of the SpreadCharts app that’s...
Read moreLiberation Day!
Tariffs are arguably the dumbest part of Trump’s agenda. Yes, the goal makes perfect sense,...
Read more