What is an index?
Index is a time serie describing change in value of some underlying assets. For example the widely known S&P 500 index tracks performance of the 500 largest US stocks.
There are cap weighted indices where each stock in the index has a weight proportional to its market cap, sometimes adjusted for free float. Good example is the S&P 500 or Nasdaq 100. Another type is price weighted index, where the individual stocks are given weights according to their price (usually divided by past splits). A good example is the Dow Jones Industrial Average.
Indices are useful in many ways. They can help you track performance of various sectors of the stock market (energy, healthcare, technologies, etc.), bond market (shorter/longer duration treasuries, US/emerging markets corporate bonds) or commodities (precious/industial metals, …).
Measuring breadth of the 500 largest US stocks
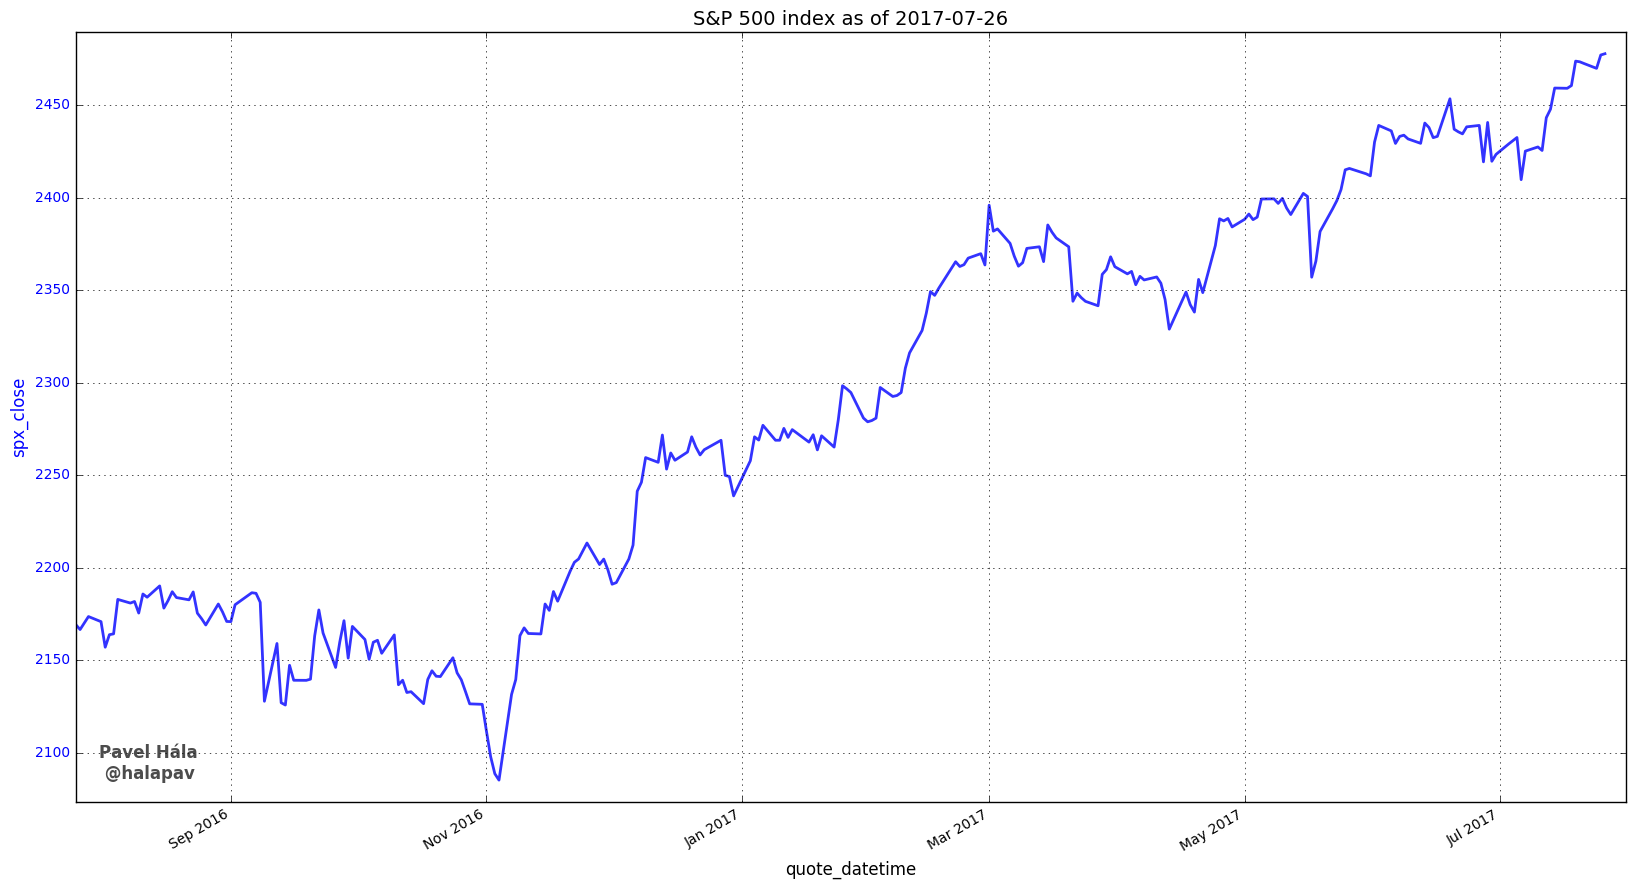
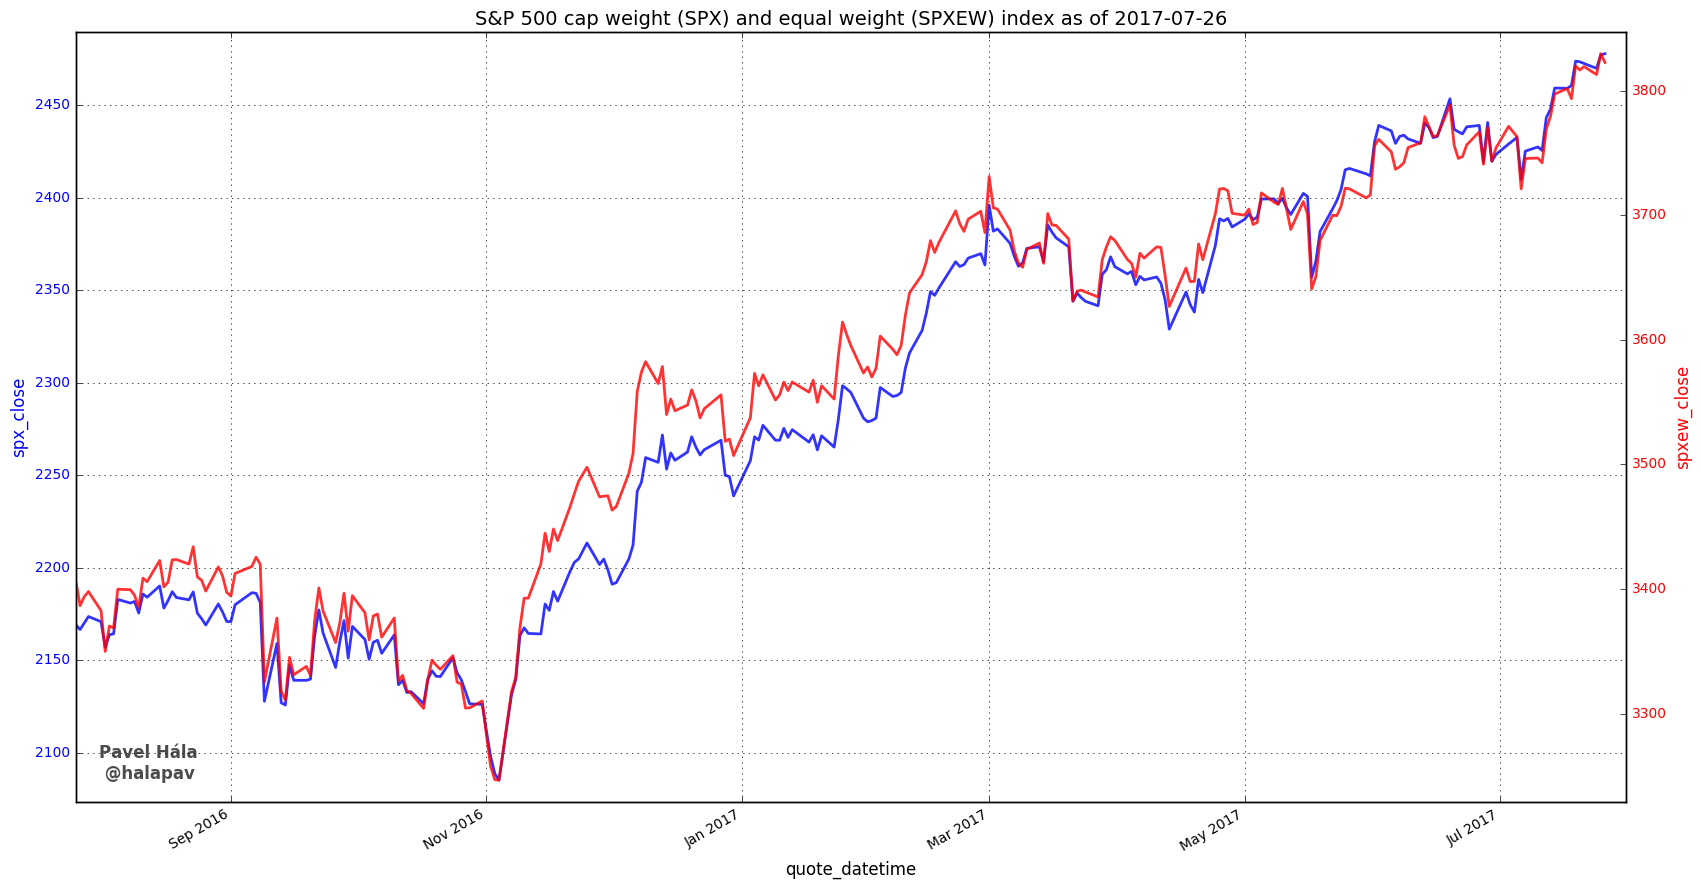
I’ll show you one example how I use indices to measure breadth among the 500 largest US stocks. As I said, the classic S&P 500 index is cap weighted, meaning the each stock has a weight proportional to it’s market value. However this create an imbalance as the index is mostly influenced only by several tens of the largest stocks.
However, there is an alternative index called S&P 500 Equal Weight index, where each of the 500 stocks has the same weight, meaning it’s a more broad based indicator of the stock market’s performance.
What I personally track is the ratio between the equal weight index and the normal (cap weighted) index (green line in the next chart). When the stock market corrects, I look for the situation when the ratio turns up, while the market is still in freefall. This tells me, that despite the widespread pessimism, institutional portfolio managers are starting to buy individual stocks they consider undervalued. This behavior usually precedes the end of correction (or at least a pause).
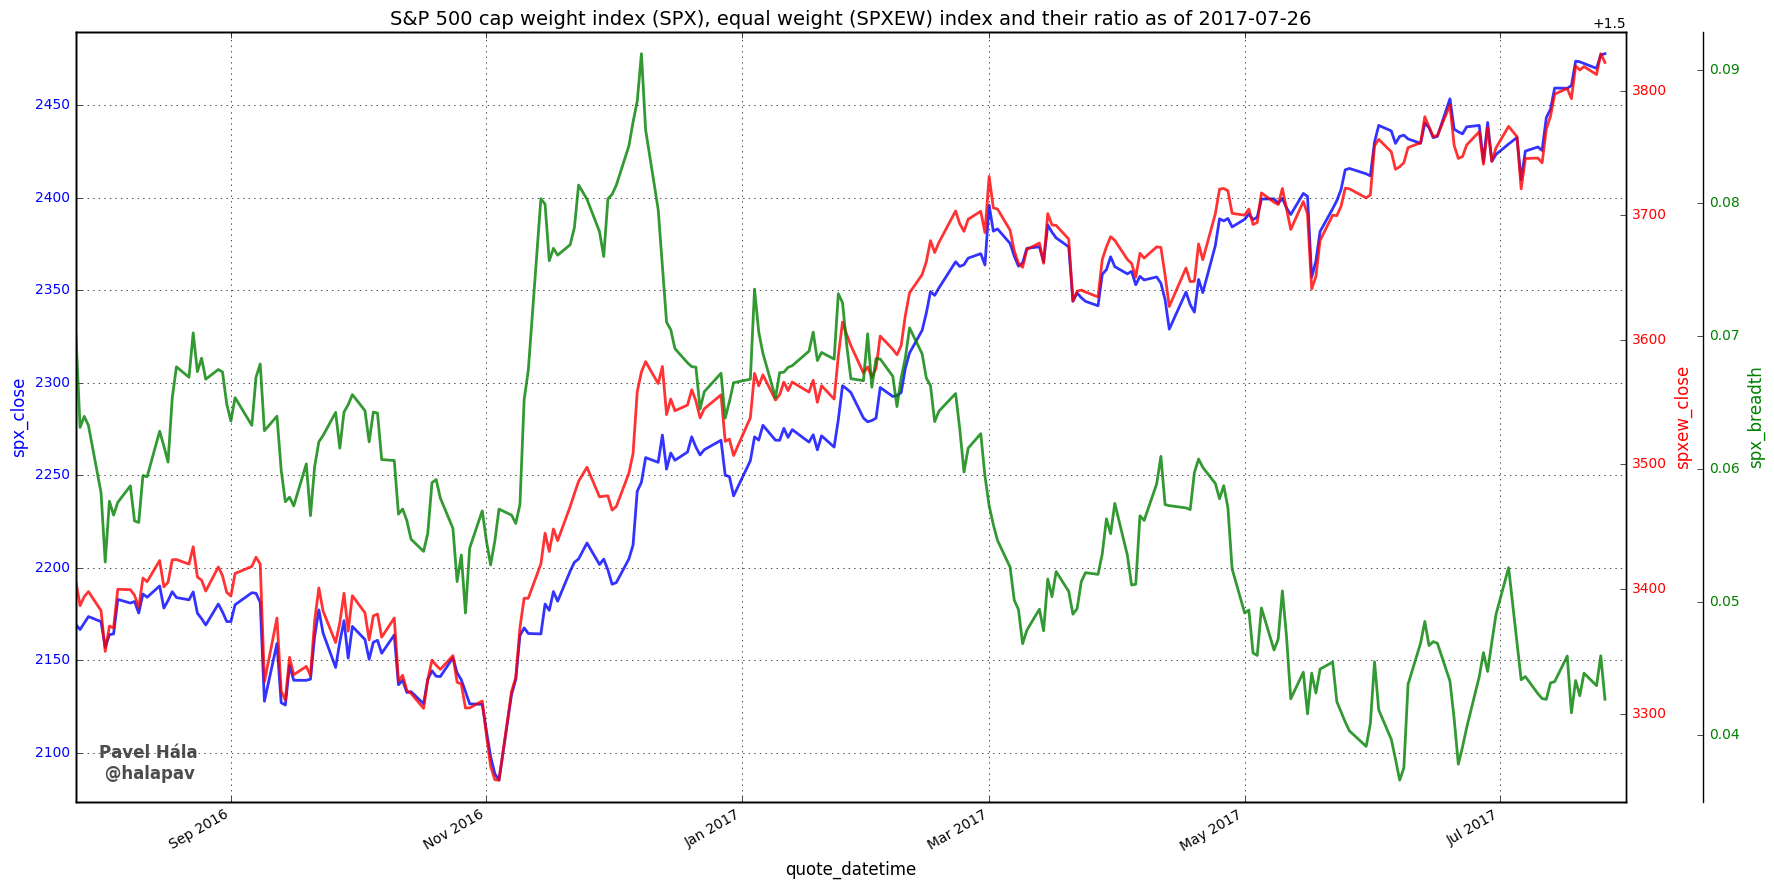
The ability to use the equal weight index is great. Imagine you’d have to compute this index on your own from prices of individual stocks. You’d have to obtain data for more than 500 stocks (because some stock are added to or kicked from the index thorough history), adjust them for splits and rebalance the weight every three months (to reset weights to be equal for each stock). A great deal of work I’d say. Luckily, there are indices like the S&P 500 Equal Weight, where someone else has done all the work for you.
Check out these great articles as well
New data: Rates and electricity
As promised, we’re adding new data to the SpreadCharts app. Importantly, the goal is not...
Read moreNew data: Sector indices
Our software is already established well beyond commodity market analysis. Stock indices, currencies, and even...
Read moreWhat’s new in the SpreadCharts app?
It’s been a few months since we launched the new version of the SpreadCharts app....
Read moreA major new version of the app is here
Today, we’re excited to show you the major new version of the SpreadCharts app that’s...
Read more