Why is the Dollar falling when stocks are cratering?
We have received the same question from several of our subscribers over the past week. It is indeed counterintuitive, as the Dollar often rallied during risk-off periods in the past.
The Dollar selloff is currently fueled by four factors:
Falling real rates

The Dollar is falling due to the steep drop in real rates. Essentially, economic growth is slowing while inflation expectations are not falling as much.
Falling US rate expectations
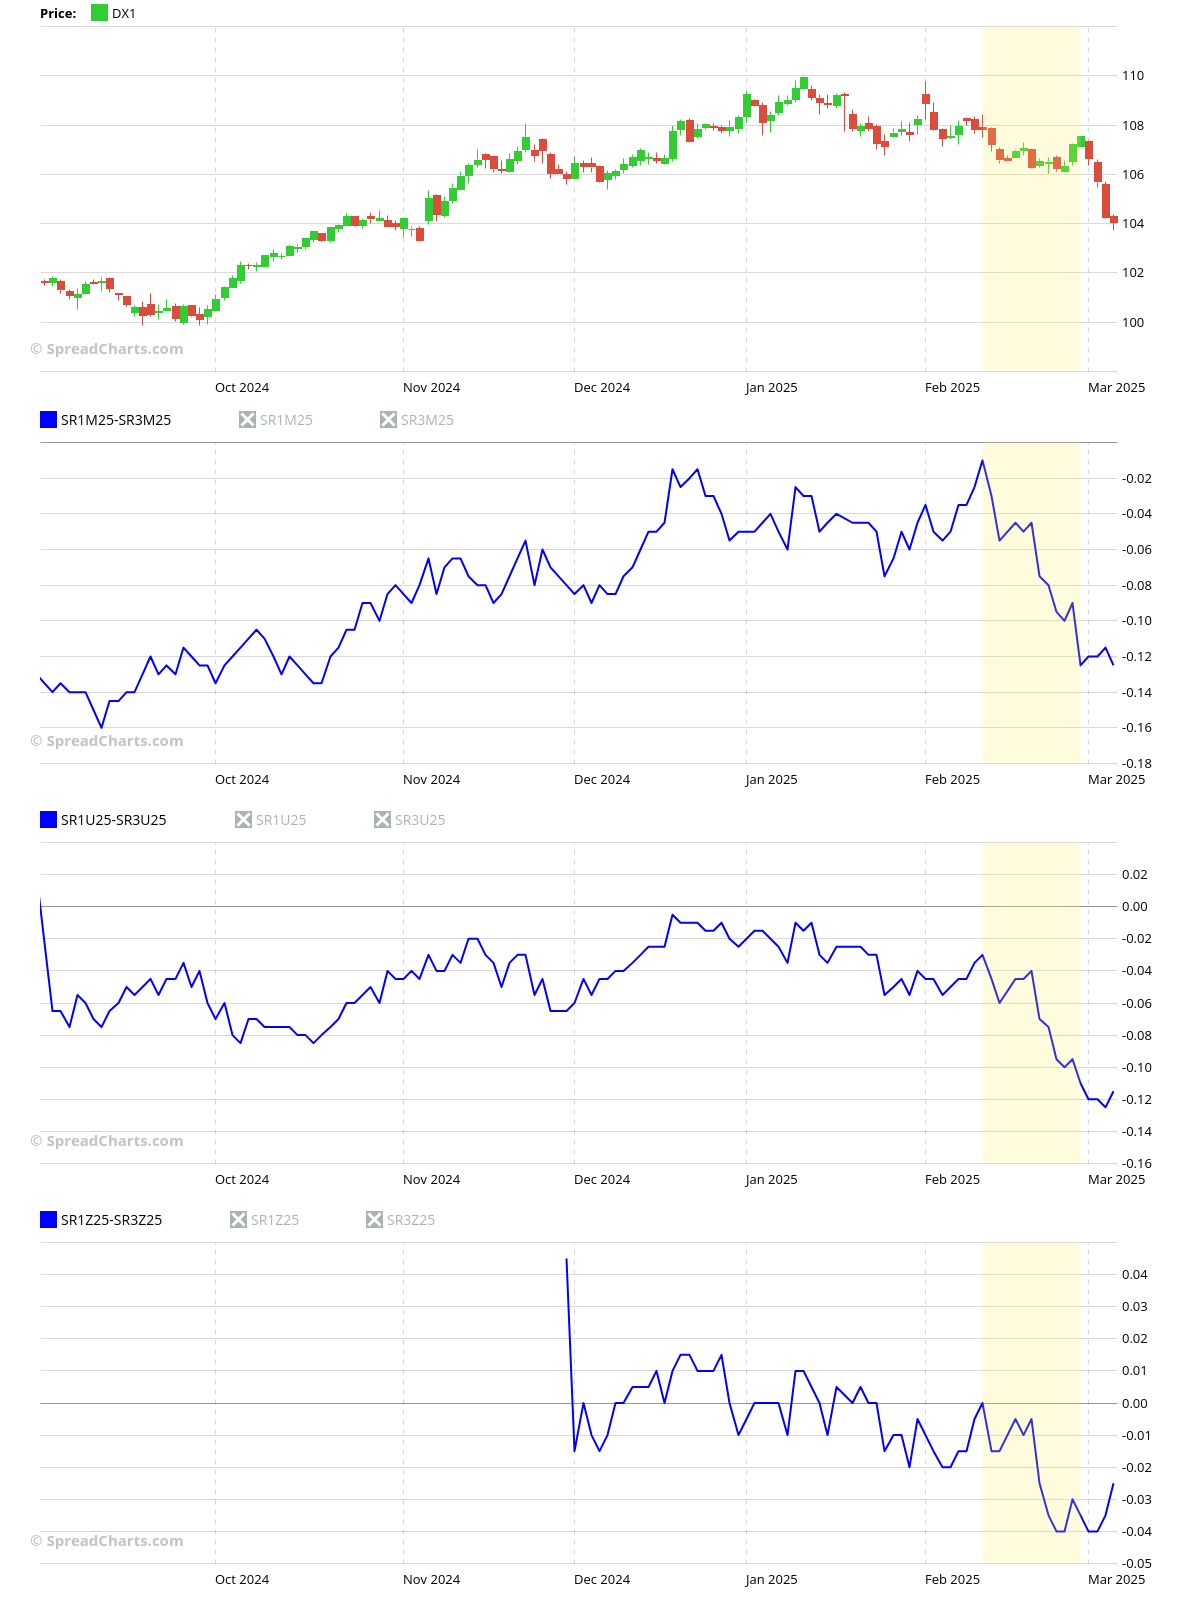
Falling real rates are putting the Fed under pressure to cut rates more quickly. The 3-month / 1-month SOFR spreads are the best way to track this dynamic, and they began falling well ahead of the Dollar. Lower rates make Dollar assets less attractive.
Expanding EURUSD rate differentials
Capital needs a place to allocate, and EURUSD rate differentials have expanded rapidly. While rate expectations were falling in the U.S., Euro rates were rising due to the proposed German abandonment of the Schuldenbremse (debt brake). Unleashing hundreds of billions of € would push both growth and inflation higher, necessitating higher rates. Moreover, financing all of this with new debt further supercharges rates, as someone would have to buy all the new supply. The short-term effect is lower US rates and higher Euro rates, which attracts capital to higher-yielding Euro assets.
Falling energy prices in Europe
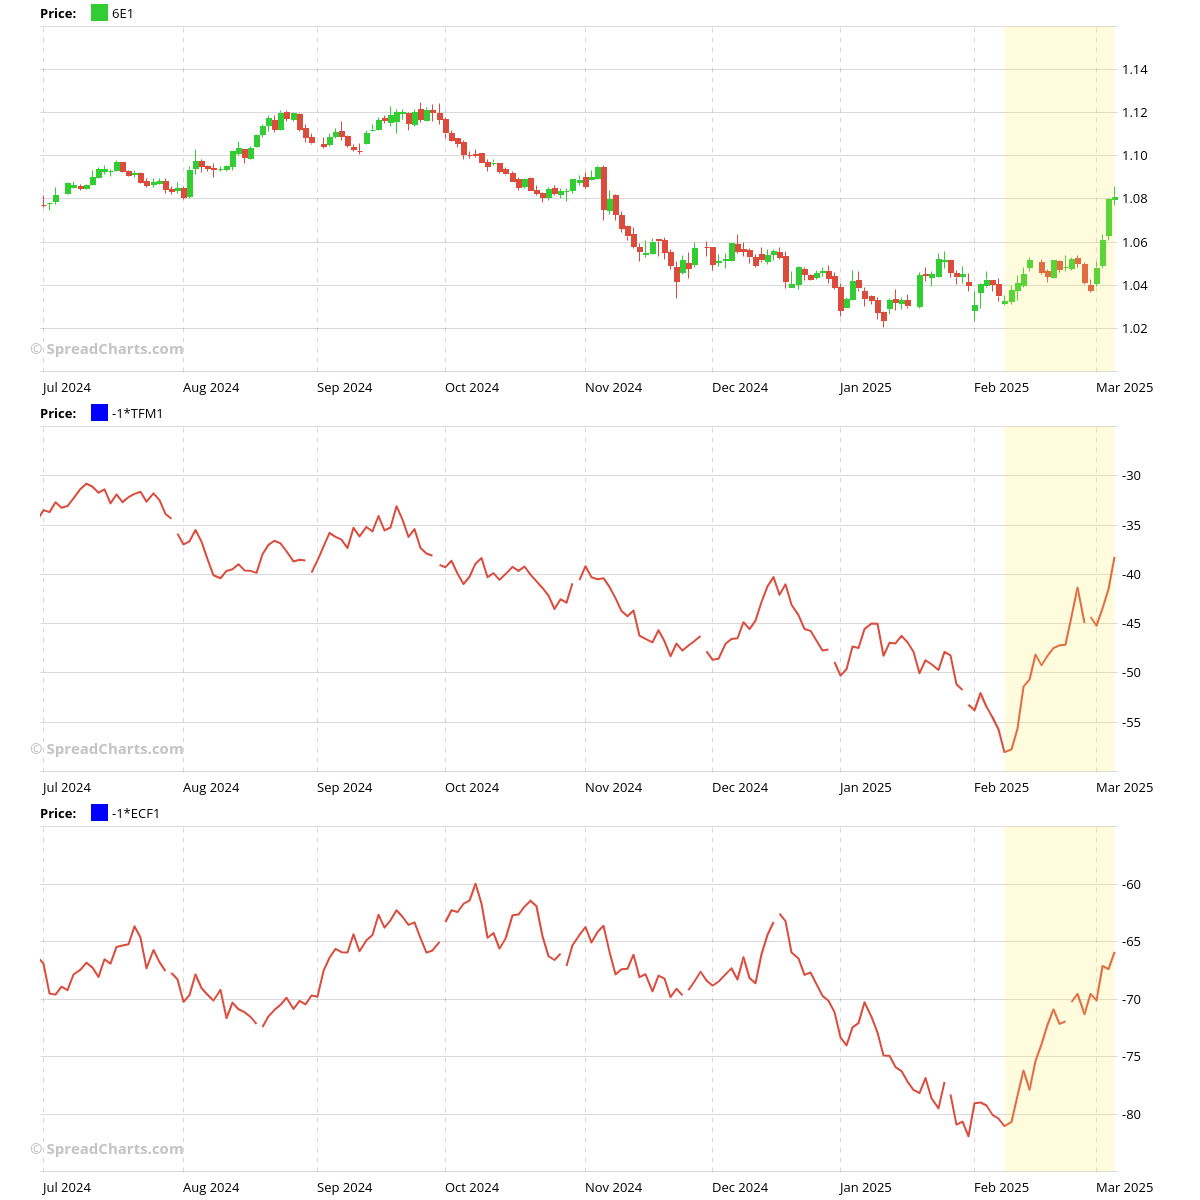
TTF natural gas and carbon prices have declined sharply (inverted in the chart above), easing pressure on the Euro. Yes, short-term weather effects now influence macro flows – welcome to Europe.
One that rules them all
However, all of these effects become irrelevant once market conditions worsen to the point of a liquidity crisis. At that moment, margin calls start coming, and asset managers sell off their portfolios regardless of price or fundamental value. We’re not there yet, and there’s no guarantee that we will be.
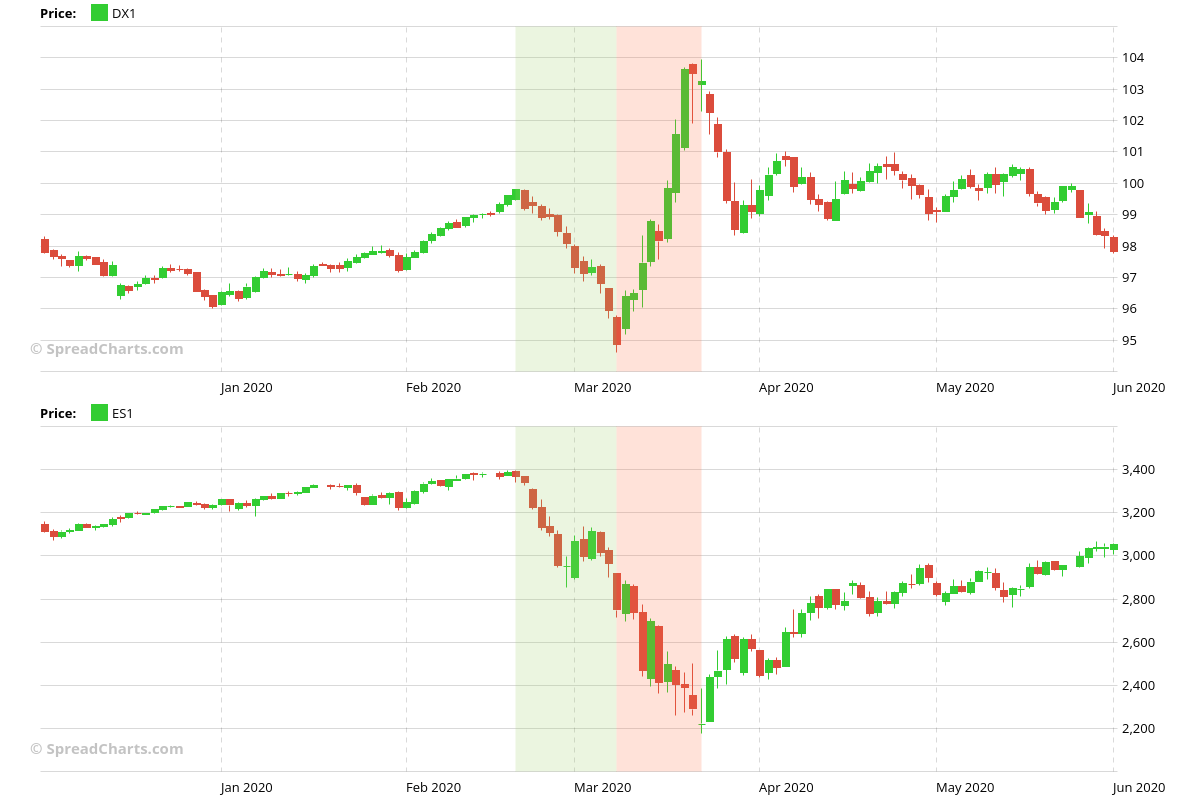
A good illustration of this phenomenon was the COVID crisis in March 2020. Initially, the Dollar fell along with stocks. But at some point, the correlation turned negative, and the Dollar spiked higher while the equity selloff accelerated.
Conclusion
So, what now? We don’t provide investment advice, so everyone must align their strategy with market reality. Personally, I wouldn’t bet against the Dollar here. If you need a clue, watch crude oil – check the contango on the back end of the curve, interdelivery spreads, cracks, etc. You can find all this data in the SpreadCharts app.
Finally, equities are in an interesting spot. I won’t try to formulate any opinions here, as they would be totally useless. I’m looking forward to my Bayesian model for the S&P 500 – the one that issued a strong sell signal prior to this selloff. Its end-of-week output will be very interesting, and of course, we’ll send it through a special email notice to all premium users over the weekend.
Get the premium version of SpreadCharts in the app or on our website.
Check out these great articles as well
New data: Sector indices
Our software is already established well beyond commodity market analysis. Stock indices, currencies, and even...
Read moreWhat’s new in the SpreadCharts app?
It’s been a few months since we launched the new version of the SpreadCharts app....
Read moreA major new version of the app is here
Today, we’re excited to show you the major new version of the SpreadCharts app that’s...
Read moreLiberation Day!
Tariffs are arguably the dumbest part of Trump’s agenda. Yes, the goal makes perfect sense,...
Read more