A closer look at the SPY ETF
Last time I described how ETFs track their underlying indices. I made my point using this chart that compares 10-year performance of the most liquid SPY ETF (red) and the underlying S&P 500 index (blue).
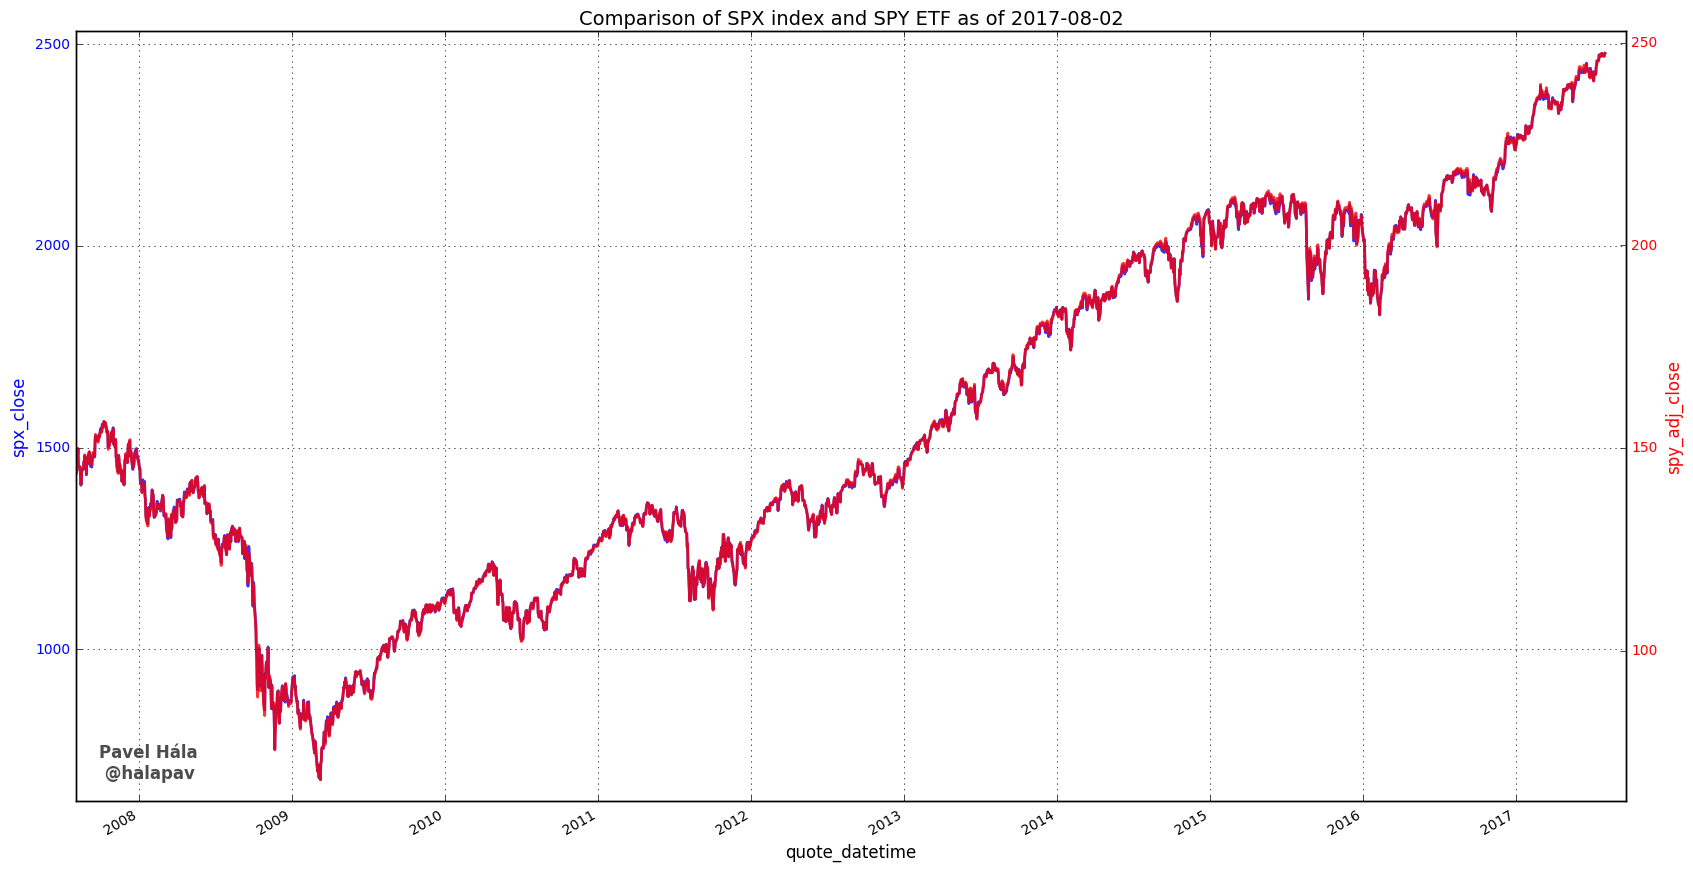
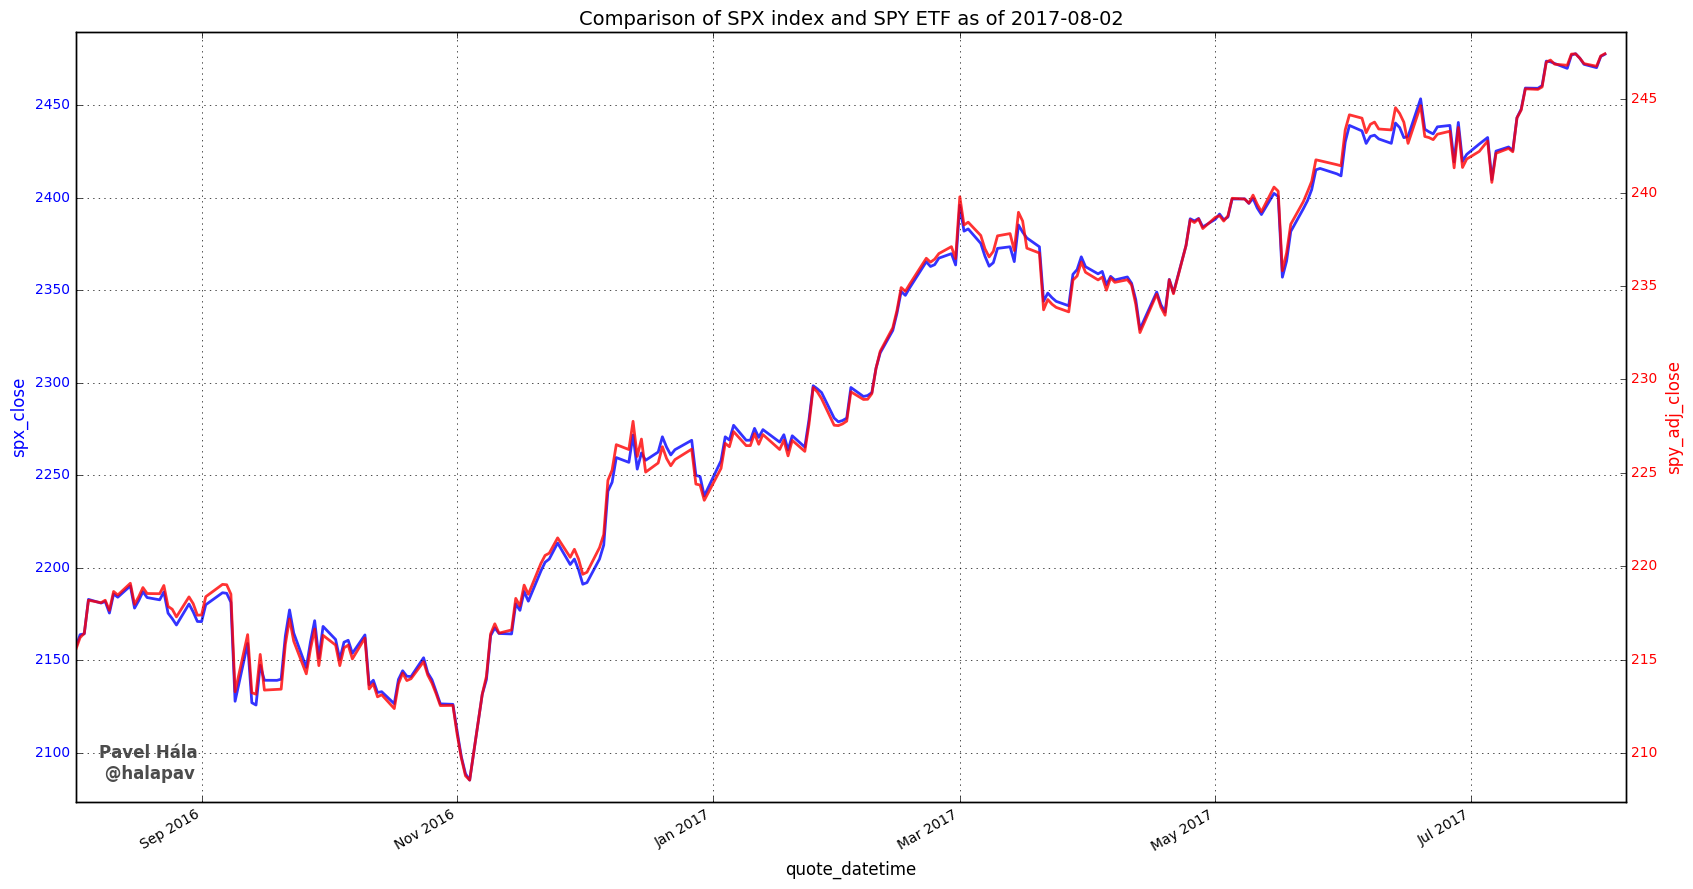
They match perfectly. However when I zoom to 1-year performance, you can notice a discrepancy. As I explained last time, it’s unlikely that this is just noise, beacause this inefficiency would be immediately exploited by market makers.
Residual analysis
The price of SPY should be 1/10th of the price of the S&P500. I’m going to test this hypothesis. Let’s take a look at the next chart, most notably the bottom figure. It’s a visualization of residuals, i.e. how the reality differs from my simple model.
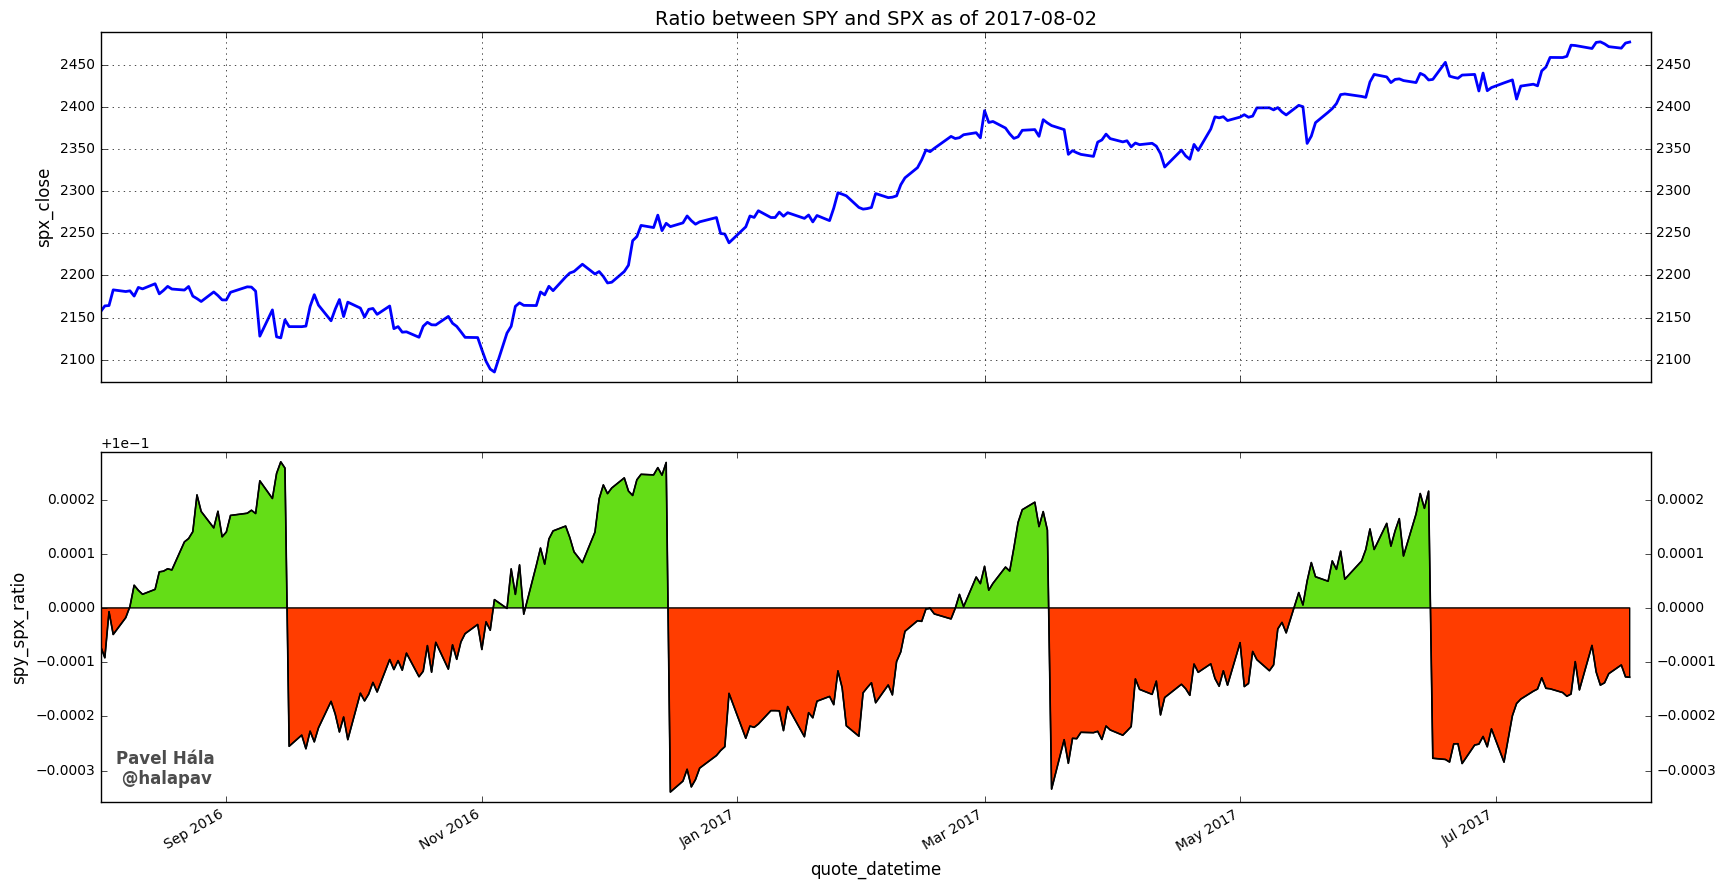
When the colored area is green, the ETF’s price is higher than 1/10th of the price of S&P500. When it’s red, it’s relatively lower. According to my initial assumption, the ratio between SPY and S&P500 (the curve) should match my model (straight horizontal line at 0) and there should be no visible color. That’s obviously not the case, which is not surprising given the second chart in this article (1-year comparison of SPY and S&P500).
However, what’s striking on the first glance is the non-random pattern in the residuals. There is a visible periodicity. This means that my simple model is probably too simple and there is some phenomenon in the market I’m not accounting for.
Dividend effect
The missing phenomenon is actually a dividend effect. The sharp drops in residuals correspond to dividend payments. The ETF (the fund) holds stocks and most of these stocks pay dividends. This money is then distributed to the ETF shareholders through ETF dividend.
When the quarterly dividend payment date is approaching, the SPY becomes slightly overvalued, because the dividend is already incorporated into ETF’s price. After the payment, it suddenly drops and then slowly builds value in anticipation of the dividend.
Expense fee
If you look carefully at the previous chart, you might notice one more thing. The ratio curve seems to be slowly grinding lower. This effect becomes obvious by looking at the 1-year chart. This is caused by the expense fee being continuosly deducted from the fund’s value.
Wild ’08
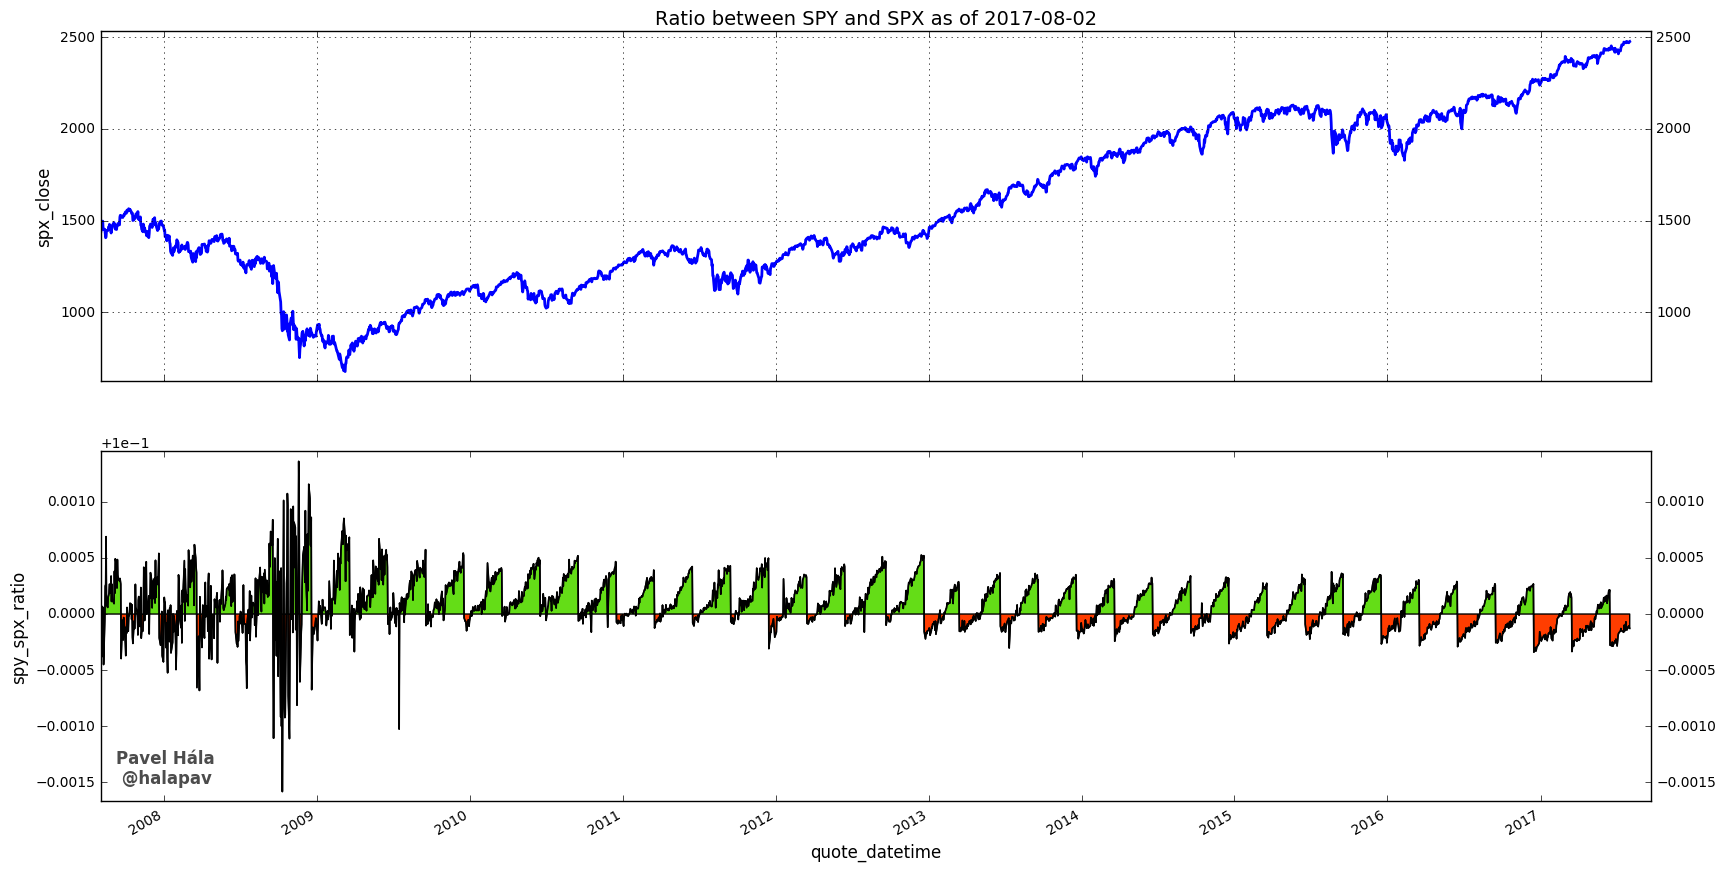
The dividend effect is clear during the years with only one exception, which is the Great Recession. Lets zoom that period.
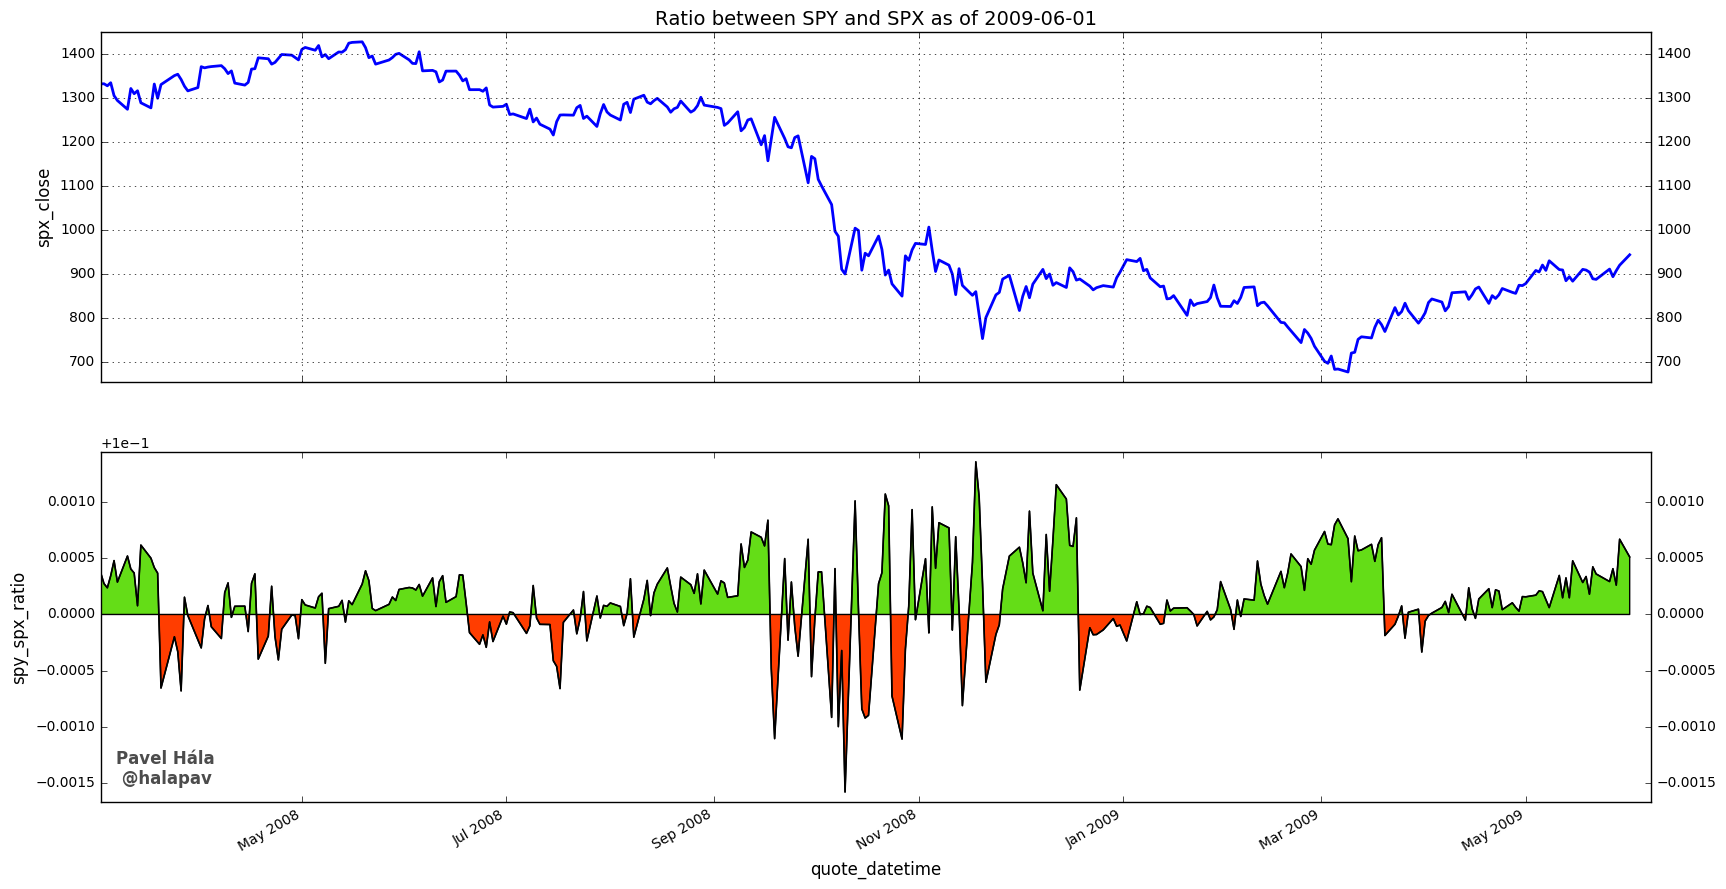
As the financial sector was feeling pain, the SPY / S&P500 ratio became irrational. I don’t know the true reason. Most likely the sudden stock liquidations and capital shortage distorted the operations of the established market makers and specialists. Nevertheless, magnitude of these swings is very small. We can definitely say that the ETF was traching its index perfectly even in such violent times.
Check out these great articles as well
New data: Sector indices
Our software is already established well beyond commodity market analysis. Stock indices, currencies, and even...
Read moreWhat’s new in the SpreadCharts app?
It’s been a few months since we launched the new version of the SpreadCharts app....
Read moreA major new version of the app is here
Today, we’re excited to show you the major new version of the SpreadCharts app that’s...
Read moreLiberation Day!
Tariffs are arguably the dumbest part of Trump’s agenda. Yes, the goal makes perfect sense,...
Read more