Commitments of Traders
As I had promised last time, I will finally delve into my quant beginnings. I consider the work in COT analysis to be my truly first quantitative achievement. COT, or the Commitments of Traders, is the report published by the CFTC (US federal agency for the supervision of commodity markets). The report is actually a huge table with positions of various market participants. Traders with futures positions above a certain limit must report their positions to the CFTC every week. These positions are then summed up and categorized into groups. The first major group is “hedgers” – i.e. subjects dealing with the physical commodity. Their goal is to get rid of the risk of unexpected price movements. They make money from their business operations, not markets. The second major group is “large speculators” such as investment banks or hedge funds. These institutions take over the risk of price movements from hedgers. Their reward for doing this is the chance for profit. It’s not the purpose of this article to explain the basics of COT analysis. The point is that the COT data provides valuable insight into the structure of the market. People who are able to interpret the data correctly get a huge advantage in trading commodity futures or spreads.
However, the interpretation of COT data isn’t easy. Raw data is stored in a CSV table with more than 100 columns. It’s nearly impossible to find important values and understand their evolution over a certain period of time. Therefore COT data is always visualized in charts. As you can imagine, downloading huge tables and selecting relevant columns in Excel is very lengthy. However, this is exactly the way I was doing COT analysis in my beginnings during the years 2007 – 2009. At that time, I was using COT to trade ETFs on precious metals, so I had to manually sort the data only for gold and silver. Even so, it took me about 15 minutes every week. The idea that I might visualize data for most commodities in this way was absolutely unreal. Then came the end of 2009 and the CFTC began publishing COT data in a new, disaggregated form. Practically, this meant the separation of swap dealers into a separate group. During the bull market in oil between 2007 and 2008, some banks disguised speculative positions of big funds as swaps for clients, which are not subject to such strict position limits. Basically, the data in the new format better reflected the activity of the hedgers in the market.
In early 2010 I had a dilemma on how to incorporate disaggregated data in my analysis. It was so fresh that even paid services hadn’t been offering it. Of course, I could remake my Excel spreadsheet, but I knew it didn’t really make sense in the long term to analyze COT this way. That was the moment when I decided to create my own program for the COT analysis. During the summer of 2010, I created a set of scripts in Bash (Unix shell scripting language). Gnuplot commands were used for generating charts. Suddenly I got the ability to create charts of the distribution of positions for dozens of commodities within a minute.
I used to send my COT analyses to several fellow traders. Because sending dozens of charts was impractical, I decided in late summer 2010 to move the calculations to a standalone server and create a website where the charts would be displayed. I attach here an example of two such charts for gold (pale blue drawings are mine):
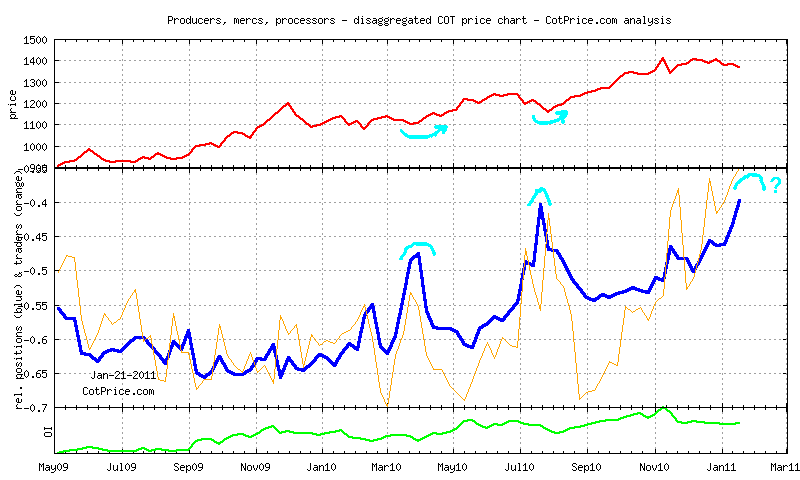
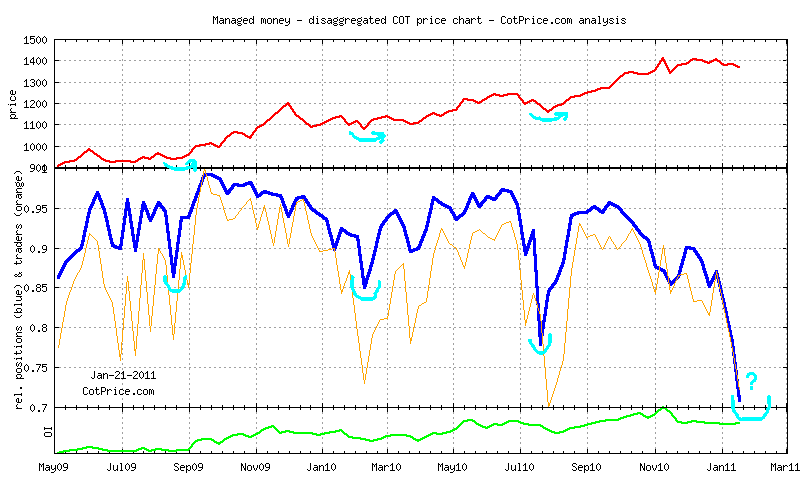
Why do I write about all this? It’s because it demonstrates one of the fundamental advantages of a quantitative trader. Sometimes you find yourself in a situation where you need to analyze data in a way that the trading platform or any other service doesn’t offer. I was exactly in this situation in 2010. I needed to visualize COT data in a way nobody was offering. The only option left for me was to do it myself. Thanks to my own coding abilities I have probably created the first website in the world where you can find COT analyses of disaggregated data.
Check out these great articles as well
New data: Sector indices
Our software is already established well beyond commodity market analysis. Stock indices, currencies, and even...
Read moreWhat’s new in the SpreadCharts app?
It’s been a few months since we launched the new version of the SpreadCharts app....
Read moreA major new version of the app is here
Today, we’re excited to show you the major new version of the SpreadCharts app that’s...
Read moreLiberation Day!
Tariffs are arguably the dumbest part of Trump’s agenda. Yes, the goal makes perfect sense,...
Read more