Commodity spreads 5: Contango vs. backwardation
In the last part of our series, we have revealed the most important thing to understand commodity spreads – the reason for the existence of contango. If you understand it, you are ready to move on.
Contango
We have already explained this market situation. It is a so-called normal market – everything goes as usual, the harvests are on time, the inventories are sufficient, etc. Contracts with a more distant expiration trade at a higher price than those with closer expiration, mainly due to storage costs.
We have also explained the term structure, where we can see the prices of all traded futures contracts. It is essential to be able to read from this curve because it tells us a lot about the market. We will gradually learn more about it. For now, however, it is enough if you can identify the market in contango, as it is on the following chart. Is it the term structure for sugar on September 29, 2017.
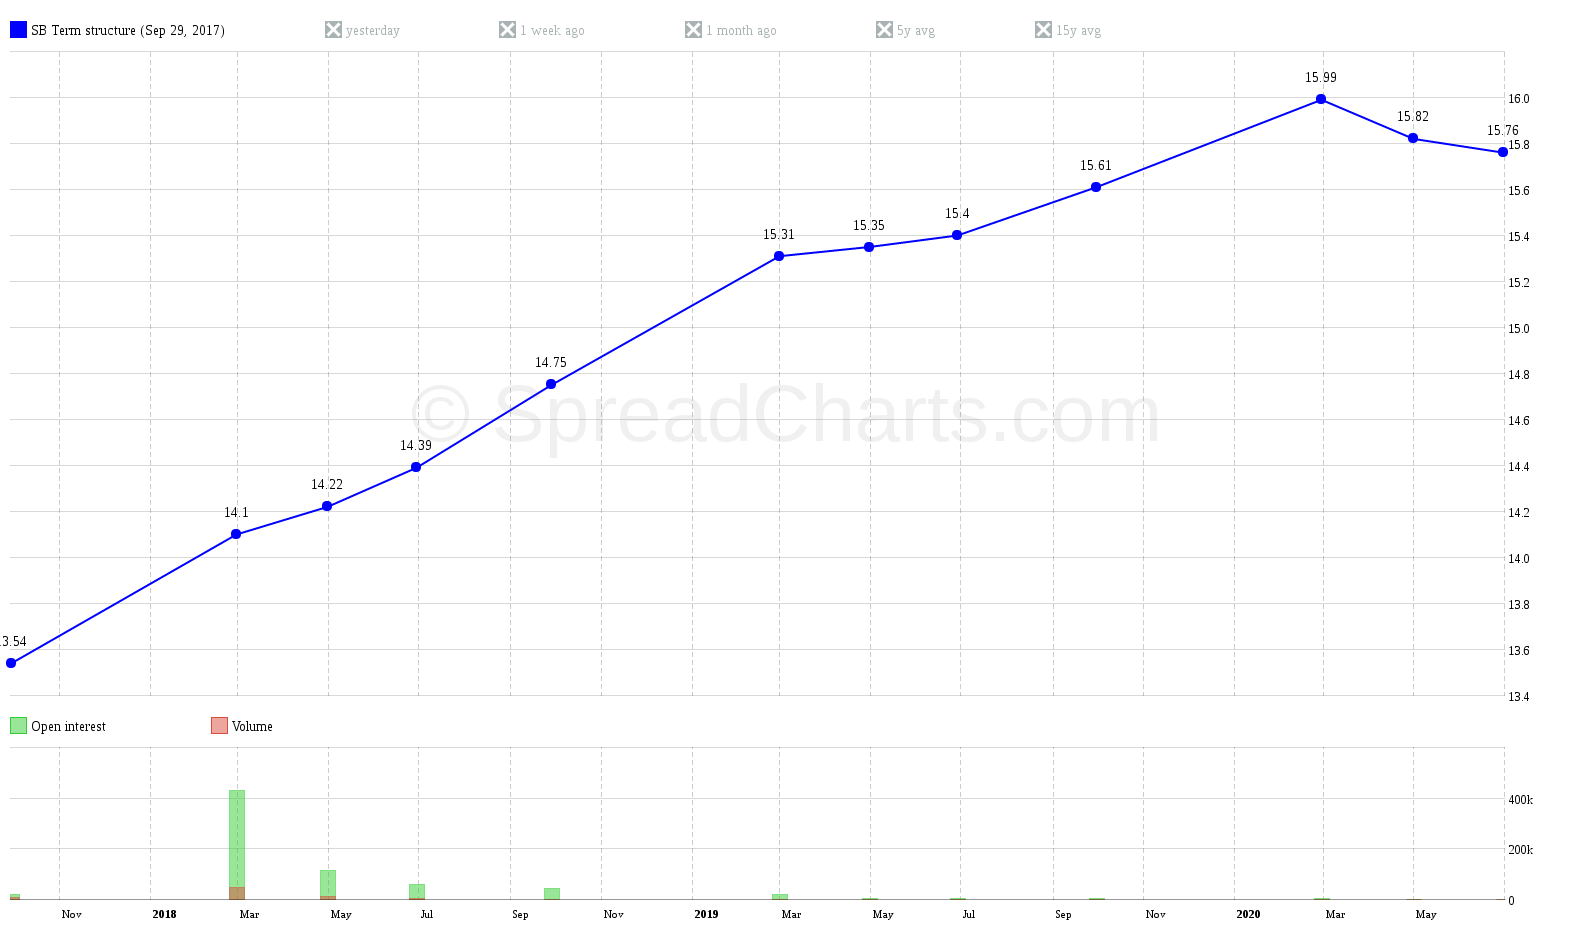
I have mentioned that the term structure is always valid for a specific date. It is important to understand the curve is not static over time. The markets are dynamic, and therefore their structure may look different every day.
Mostly, the situation from day-to-day does not change radically (but it can happen). However, over weeks or months, the changes can be significant. Look, for example, at the same market (sugar), but at the beginning of 2017.
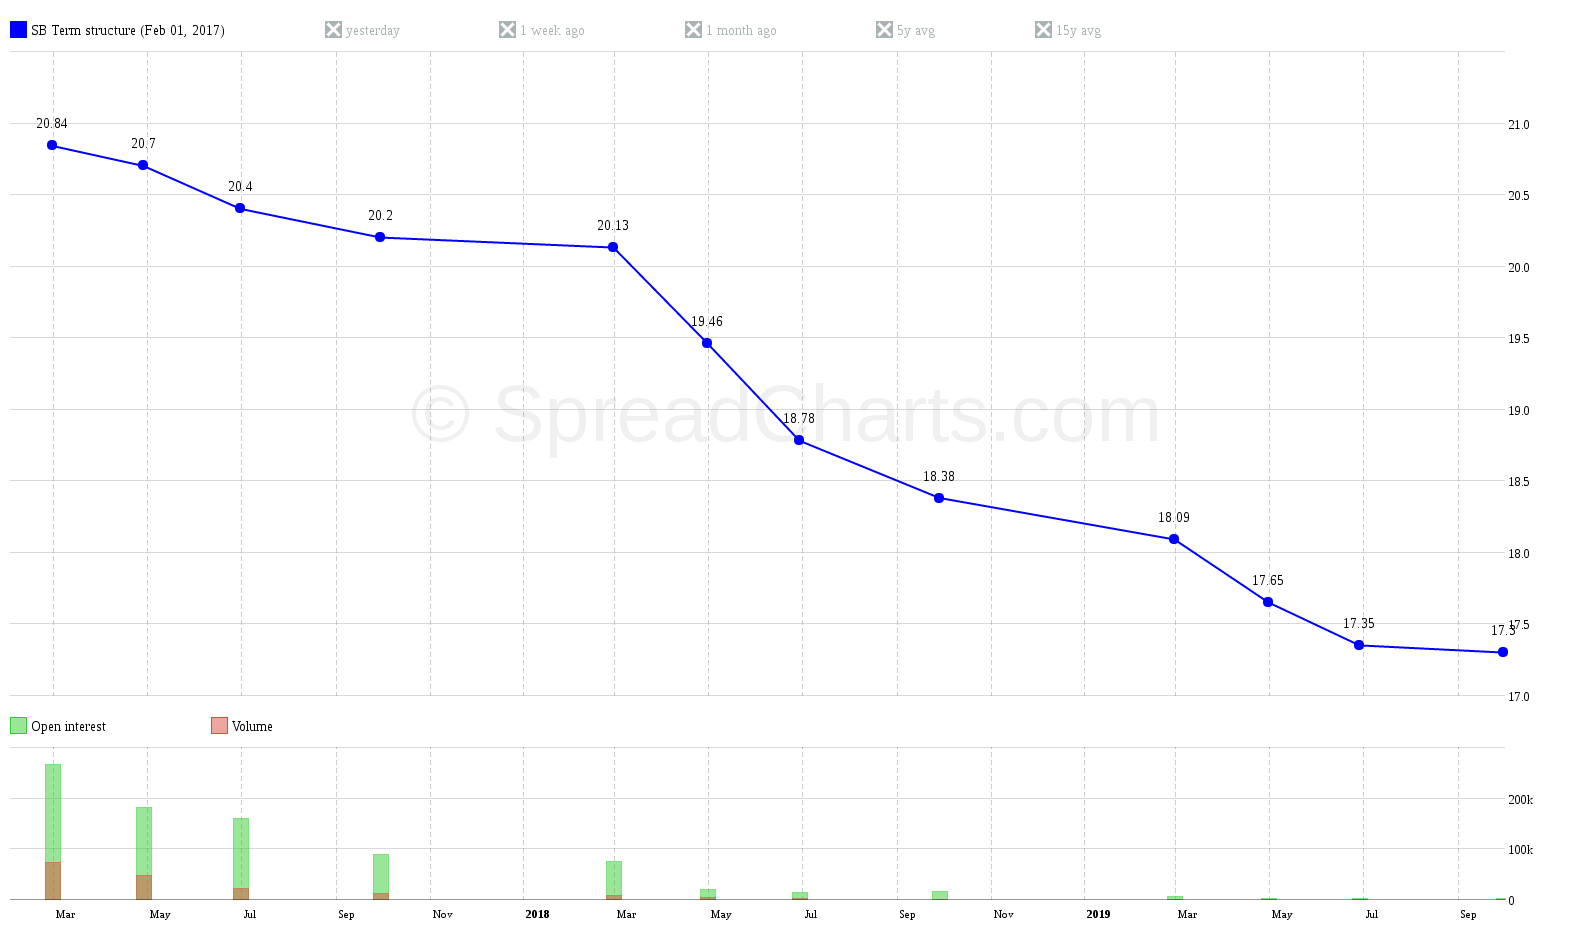
Big change, isn’t it? Here is a beautiful example of how markets are changing, how dynamic they are, and that makes them interesting. Market structure and the price range between contracts change over time. Should the markets be static, we would not be able to make a profit as spread traders.
Backwardation
Contango is therefore clear – with the increasing time to expiration, the prices of contracts are rising. On the previous sugar chart, however, you could see exactly the opposite situation – the term structure curve was falling. In other words, the more distant contracts were cheaper in February than the closer ones. And the closest contract (so-called front contract) was the most expensive. We call this market state a backwardation.
In such a situation, the market tells us that there is an increased demand for the commodity with the current or closest possible delivery date. And when does that happen? There are usually two scenarios:
- there is a problem on the supply side – e.g. bad harvest, weather damaged the crop, closed pipeline, animal disease epidemic…
- a sudden increase in the demand – for example, a change in the law on the proportion of ethanol in gasoline, declaration of intent…
Those who need the commodity are willing to pay extra money, only to be sure that the regular deliveries will be secured. How the situation looks in a year is too far away at that moment. The market can deal with the supply/demand imbalance until then, for example by increasing production. Therefore, more distant contracts are less expensive.
It is fascinating to see how the markets behave. Once we understand it and learn how to read from the term structure, we will not be bored at all. I enjoy it very much because as I have already written, markets have their logic, what is happening has some cause, and we can benefit from it.
What’s for the next time?
If you already understand the term structure and the different market conditions, it is time to look at concepts of bull and bear spreads. And that’s what I’m going to talk about next time.
Check out these great articles as well
New data: Sector indices
Our software is already established well beyond commodity market analysis. Stock indices, currencies, and even...
Read moreWhat’s new in the SpreadCharts app?
It’s been a few months since we launched the new version of the SpreadCharts app....
Read moreA major new version of the app is here
Today, we’re excited to show you the major new version of the SpreadCharts app that’s...
Read moreLiberation Day!
Tariffs are arguably the dumbest part of Trump’s agenda. Yes, the goal makes perfect sense,...
Read more