Commodity spreads 8: How is it possible that spreads are changing?
In the last part of our series, we have explained a very important thing – interdelivery spreads are basically a form of hedging. And thanks to this, we can trade them with a lower risk compared to outright futures contracts. That’s great. However, we still need to understand how can we make a profit on this type of spread. How is it possible that the spreads are either expanding or narrowing?
Intermarket Spreads
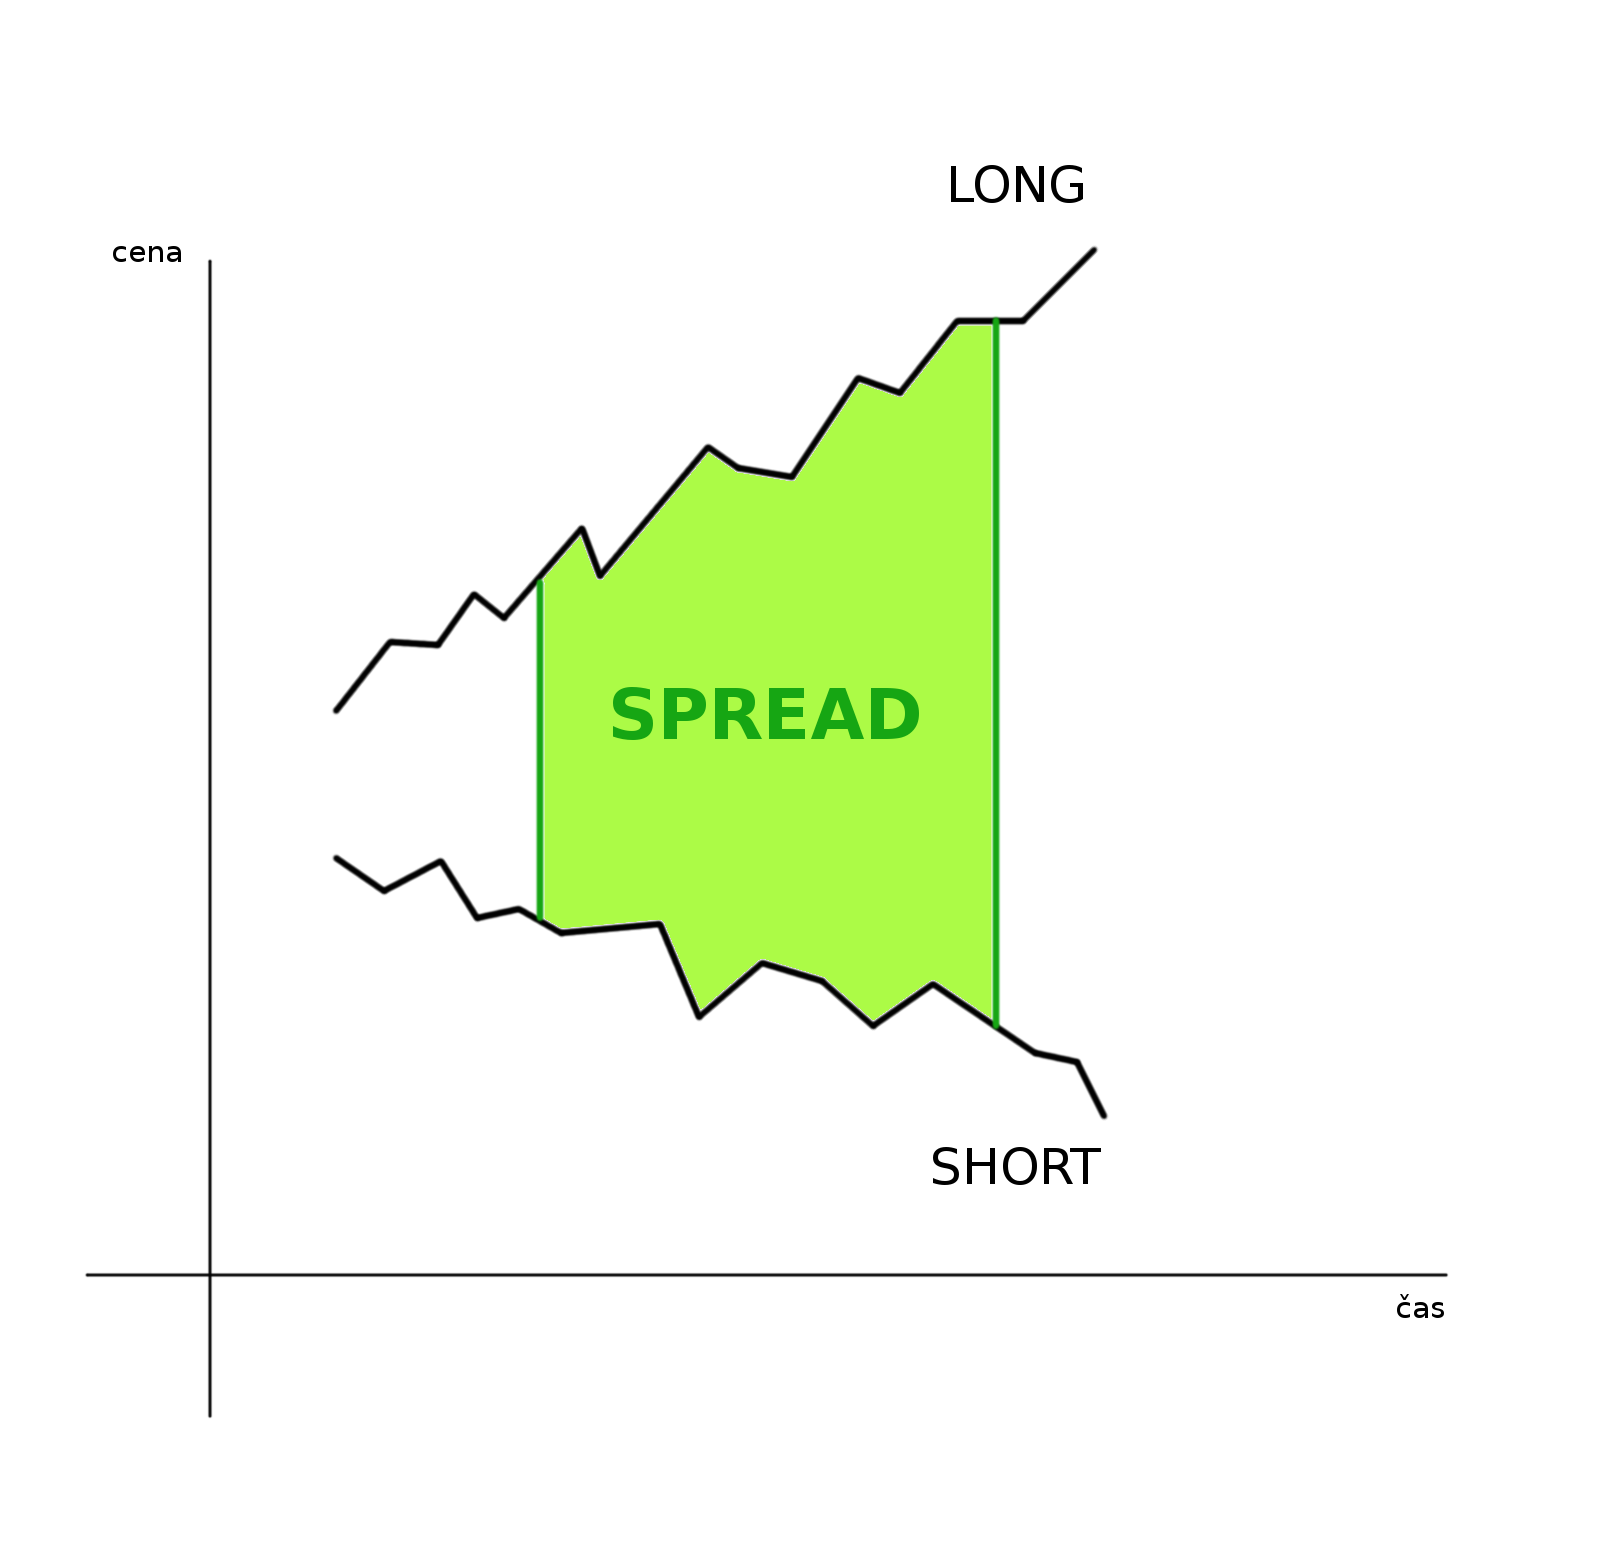
Let’s say we are holding an intermarket spread between wheat and corn, for exaple ZWN18-ZCN18. The ideal situation would be when the wheat contract will rise, and the corn contract will fall. This can be easily imagined. This situation can be seen in the following scheme:
Interdelivery spreads
But what about the interdelivery spreads? Both legs of the spread belong to the same commodity. We already know why contracts with different expiration have different prices. The reason is the existence of a market structure – either contango or backwardation. But how is it possible that spreads change? For example, if the price of a commodity rises, all contracts should increase equally, isn’t it?
If that would be the case and all contracts would rise or fall equally, it would mean that the term structure does not change. In other words, it would only move up or down. However, try the SpreadCharts.com app to see the current term structure of the natural gas and compare it with the term structure a month ago. You will see a huge difference.
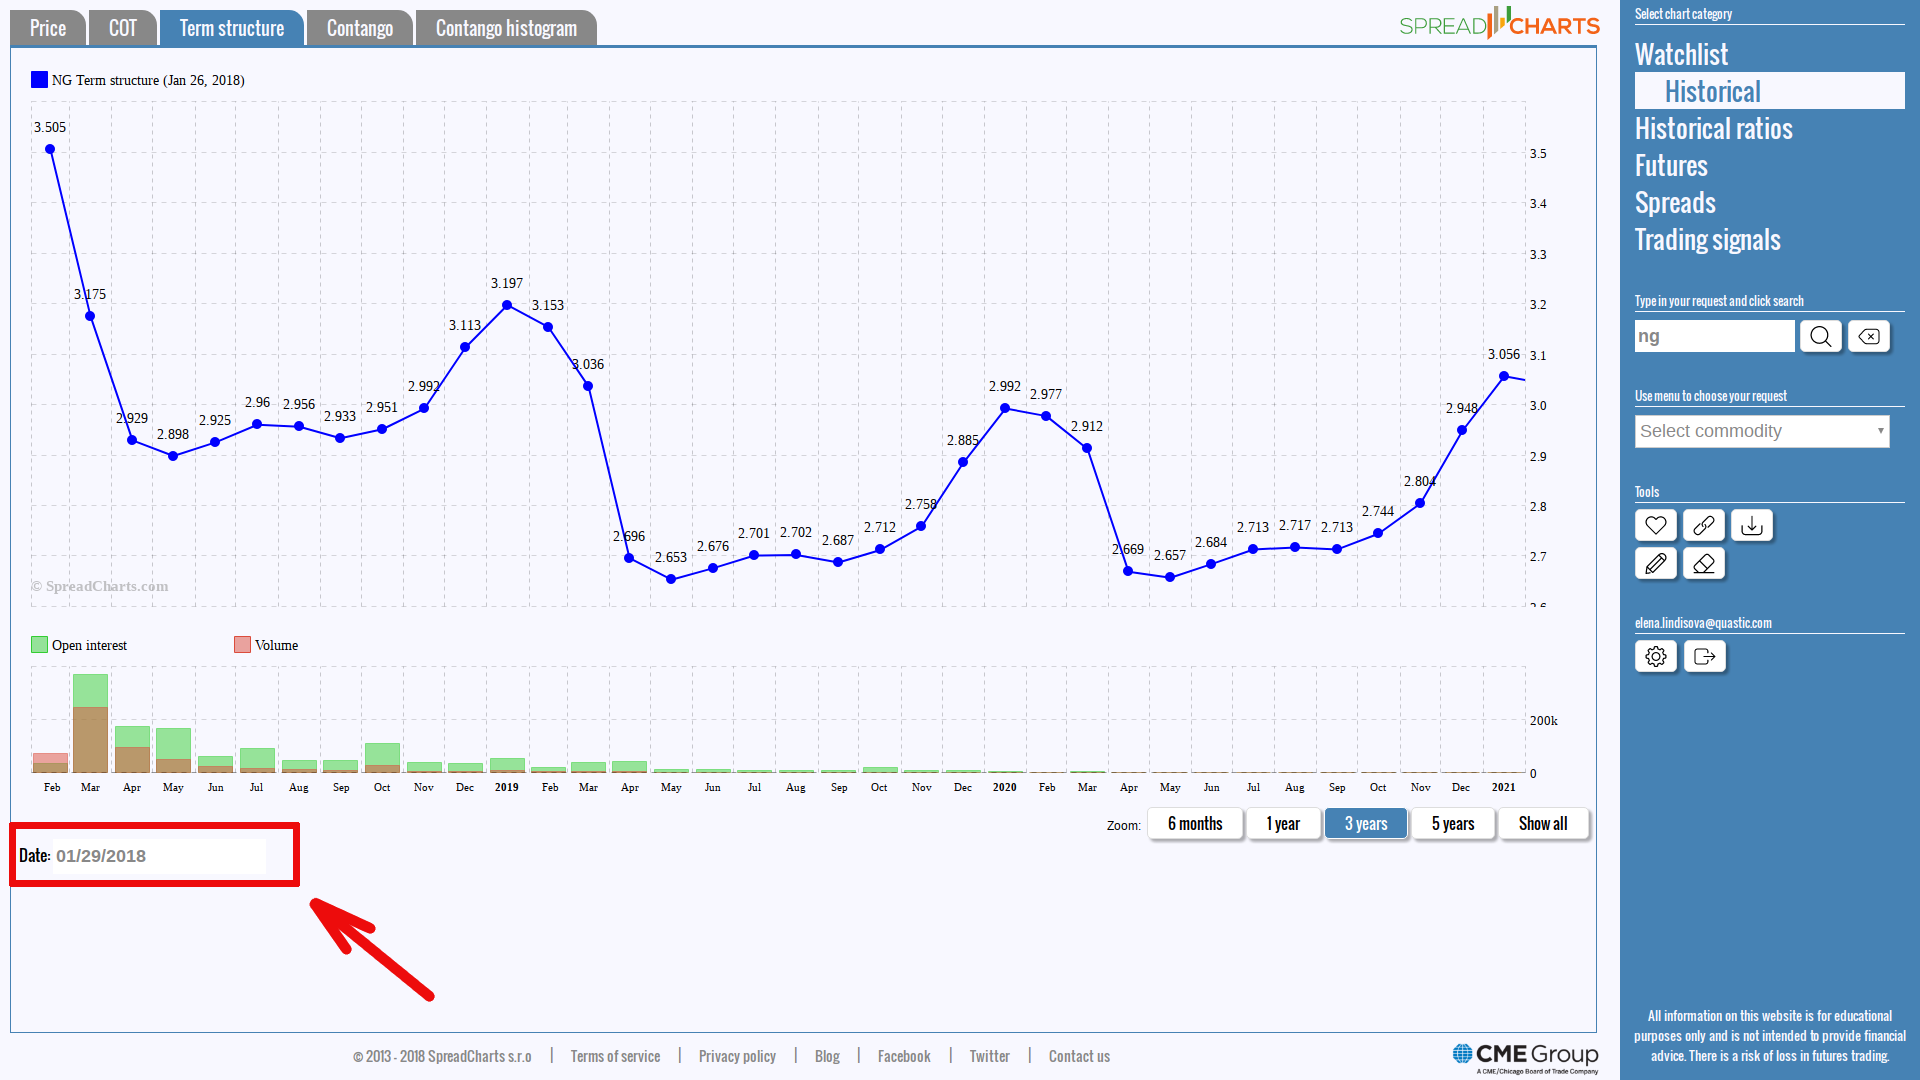
The arrow points to the input field where you can select a term curve for another date.
You probably know what I mean by this. Term structure curve does not always have the same shape! This is a fundamental fact that must be understood by all spread traders but also by outright futures traders. The term structure may stretch or flatten, may become curly, and may even change the shape from contango to backwardation.
Imagine the term structure as a stretched rubber band. Mark two points on it, among which the vertical difference will represent a certain spread. And if you stretch this rubber band differently, the distance between the marked points (or our spread) will increase or decrease.
Now let’s move the two points on our rubber band to the term structure. Any change on this curve will then also represent movements of the interdelivery spread. And that’s why we can trade it and make money from it.
Summary
From today’s lesson, you should remember one very important fact – the term structure is NOT STATIC. Markets are dynamic, they’re changing over time. Our interdelivery spreads reflect different market conditions. We can understand a lot about the market from their behavior. Spread development is therefore not only important for spread traders, but for all commodity traders. If we truly understand the spreads, we can take a look deeper into the market and we can better estimate future movements.
What’s next?
Now we are ready to learn how to assemble a spread. I will explain the strategies of bull and bear spreads. You certainly have a reason to look forward.
Check out these great articles as well
New data: Sector indices
Our software is already established well beyond commodity market analysis. Stock indices, currencies, and even...
Read moreWhat’s new in the SpreadCharts app?
It’s been a few months since we launched the new version of the SpreadCharts app....
Read moreA major new version of the app is here
Today, we’re excited to show you the major new version of the SpreadCharts app that’s...
Read moreLiberation Day!
Tariffs are arguably the dumbest part of Trump’s agenda. Yes, the goal makes perfect sense,...
Read more