Data > opinions
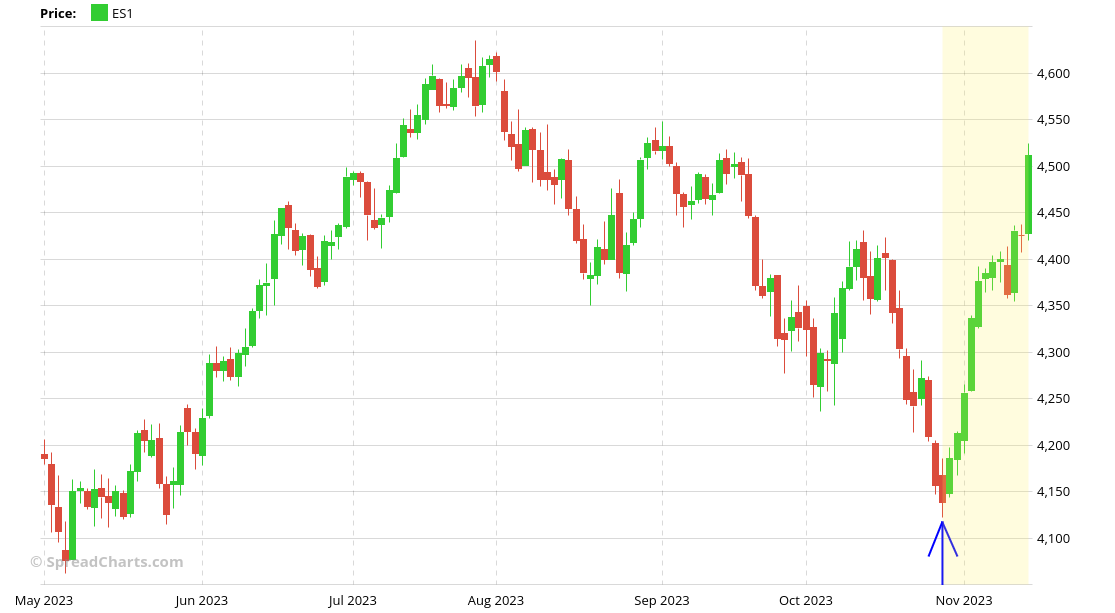
Two weeks ago, my Bayesian model for the stock market flashed a strong buy signal. At the same time, my own personal opinion was that stocks would go even lower in the short term.
But when it comes to trading, I strictly follow the data, not my opinions. And that turned out to be the right thing to do, as my model managed to pick the exact bottom. The S&P 500 surged by 10% since then in just two weeks. It’s been definitely the most ferocious rally this year.
And of course, you did not miss the rally either, as we informed the premium users of SpreadCharts about the buy signal right at the time. We’re releasing the original video for everyone to see as proof below. Our research continues to print money.
Get on board if you don’t want to miss such an opportunity next time.
Check out these great articles as well
New data: Rates and electricity
As promised, we’re adding new data to the SpreadCharts app. Importantly, the goal is not...
Read moreNew data: Sector indices
Our software is already established well beyond commodity market analysis. Stock indices, currencies, and even...
Read moreWhat’s new in the SpreadCharts app?
It’s been a few months since we launched the new version of the SpreadCharts app....
Read moreA major new version of the app is here
Today, we’re excited to show you the major new version of the SpreadCharts app that’s...
Read more