Inflation is here!
Inflation is here, there’s no doubt about that. Last week’s US Consumer price index data surprised everyone. The year-over-year number, which you see widely circulating in the media, was reported at 4.2%. That means the price of the basket of goods in the benchmark is up by more than 4% compared to the April 2020.
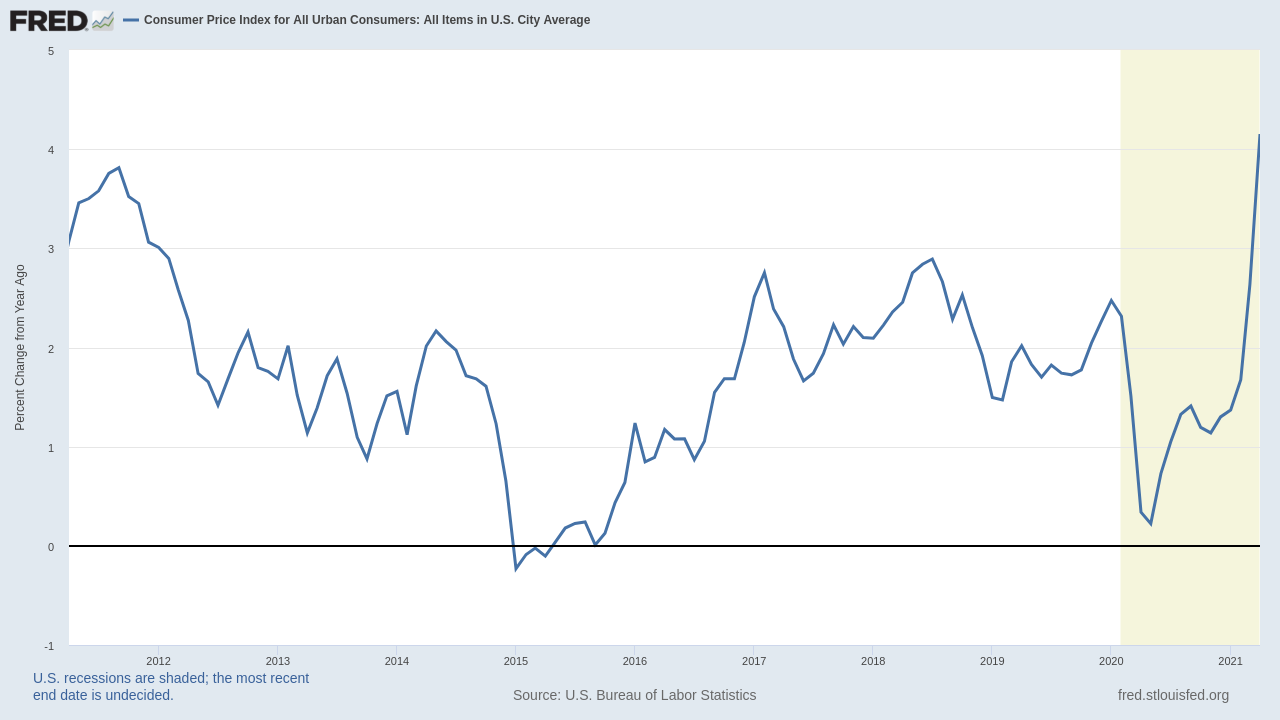
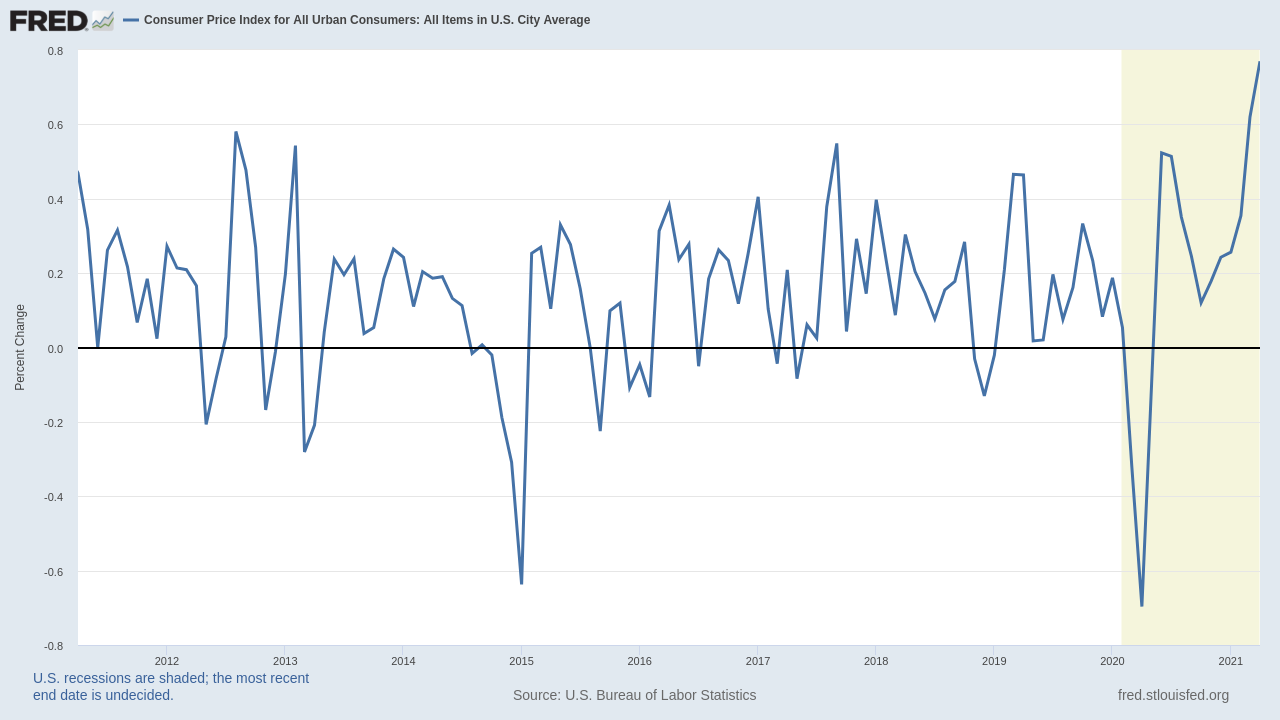
While this number is very high, you would rightly admit it’s distorted by COVID, which had the greatest economic (not medical) impact last spring. And you would be right. However, even when we take a look at month-over-month data, we’ll get 0.8% which is still the highest monthly increase over the past 10 years. No matter how we analyze the data, the inflation has arrived.
Inflation that is or was?
Ok, so is it time to dump your cash before it’s worthless? Well, no. At least not exactly right now.
The first reason is that macroeconomic statistics are kind of low-frequency data. They tell you about the events that already happened. The correct headline should be “The inflation WAS here”. If you follow the markets, you witnessed the inflation in the price of commodities over the past year. If you failed to make use of this trend, it’s already too late (in the short term).
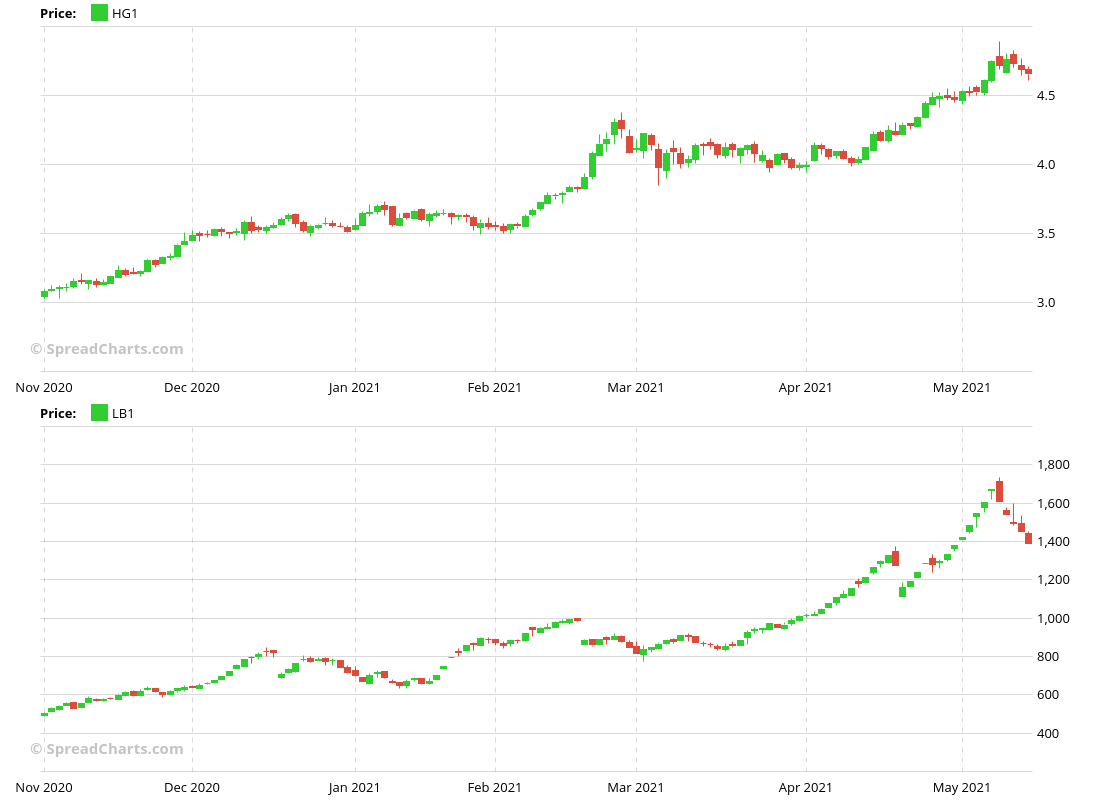
The second problem lies in the current data. The markets are the leading indicator, not the macro data. And if you look around, you’ll see the prices of industrial metals like copper and construction materials like lumber reversing over the past week.
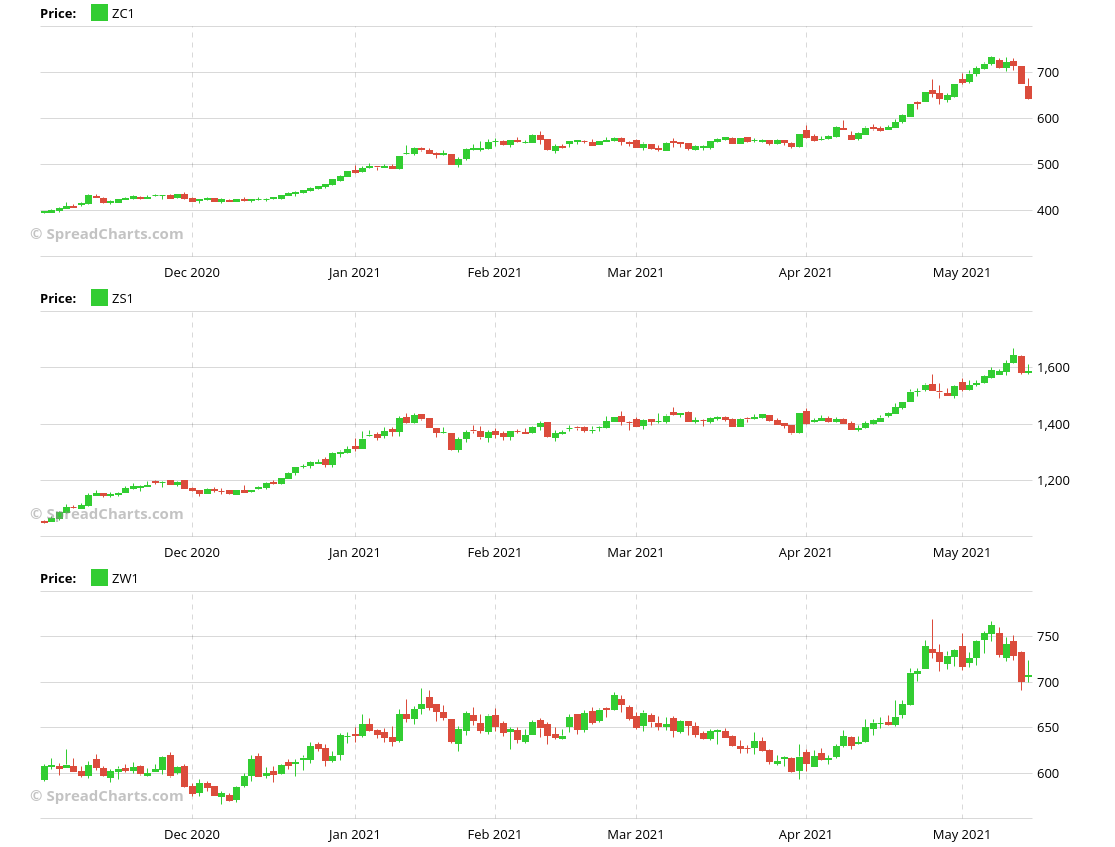
The same is true even for agricultural commodities like grains. Btw corn made a limit-down move last week. Maybe this is nothing, and prices will make new highs over the coming weeks. But until that happens, the current weakness is problematic.
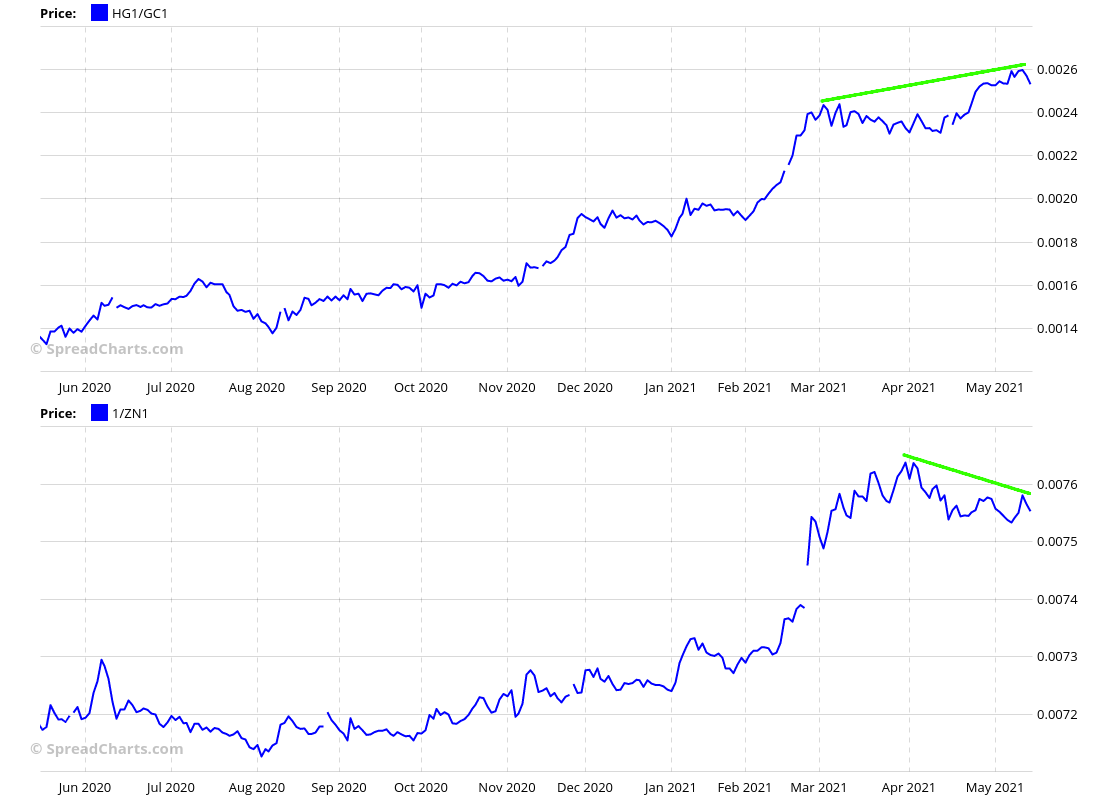
One chart is especially interesting. It shows the copper/gold ratio and inverse 10-year treasury price. Both have been a good benchmark for the rising inflation over the past months. And notice the divergence, one of them is clearly wrong. I’m eager to see which one.
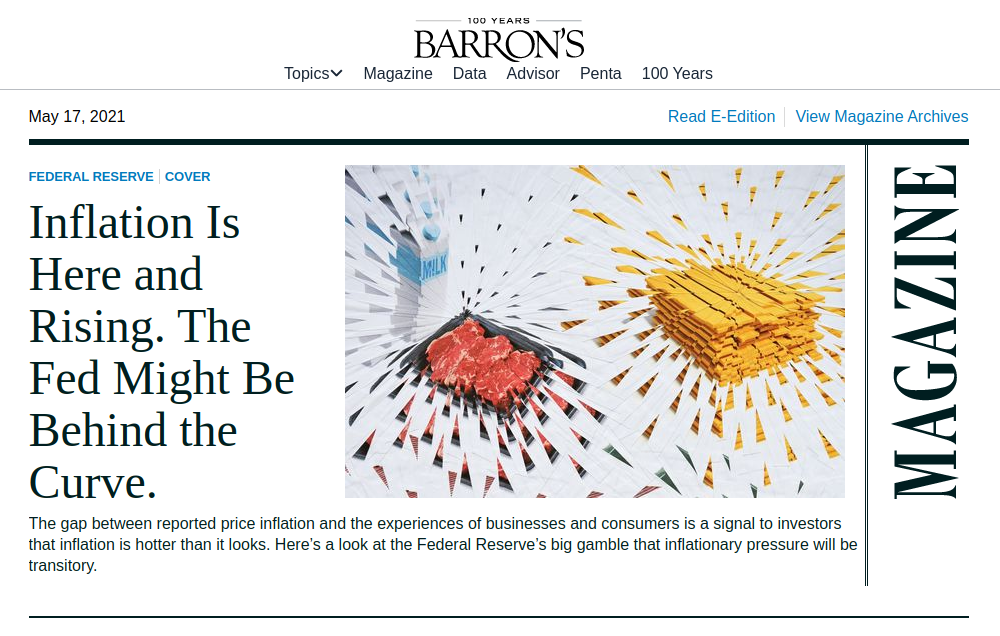
The third issue is sentiment. Here’s the latest cover of Barron’s magazine.
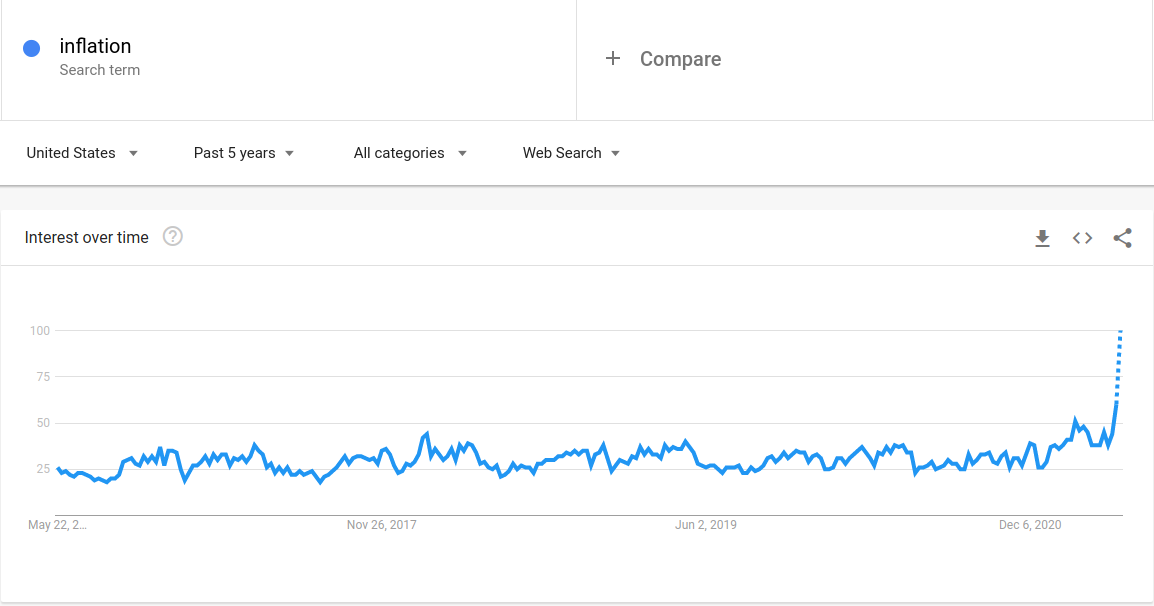
And if you’re looking for something quantifiable, here’s the data for “inflation” in Google Trends. The searches for inflation have exploded.
Time horizon is crucial
The correct interpretation of these facts is critical. We extensively covered the battle between inflation and deflation in the last quarterly macro outlook in our research. We’re not surprised as we identified these inflation pressures in advance. On the other hand, we told you it’s likely the inflation expectations will reach an extreme at some point in the medium term (this year). That will lead to a reversal in this market narrative and prices of many commodities. We may be approaching this point.
We just published our extensive quarterly 🌎macro outlook🌏
▶️ employment trends in the USA
▶️ the battle between accelerating inflation and deflation risks
▶️ the steepening yield curve and its effects on equities
▶️ market breadth and credit spreads$SPX $SPY $QQQ $TLT #DXY pic.twitter.com/jmDEvDlLmK— SpreadCharts.com (@SpreadChartsCom) April 4, 2021
But the timing is tricky. The inflation and, therefore, commodity prices may accelerate well into summer before correcting. Or maybe it’s already here, and the reversals on the charts above will continue. We don’t know. But we’re fairly certain a correction is only a matter of time.
On the other hand, don’t misinterpret our time horizon. We expect a higher inflationary environment over the long term, i.e. in the years to come. Such times are associated with rising commodity prices. The bull market is just starting. I won’t delve into details here, but there are structural supply deficits on many commodities. Narrowing this deficit will take a long time. In other words, it takes many years to build new copper mines, develop natural gas fields, etc.
How to trade the correction
You might ask a question about how to trade this correction. It would be no easy task. First of all, it’s generally not a good idea to short against such a powerful trend. The only way is to do it very small or wait for the trend to weaken first. The second problem is that we don’t know how the correction will look like. It doesn’t have to be a sharp selloff. Sometimes a sideways chop is enough to reset the crowded sentiment. And it’s hard to profit from such consolidation. We don’t know if it will be a correction in price or in time.
Nevertheless, active traders may be interested in some signals our AI model on SpreadCharts discovered recently. Some of those opportunities we highlighted might benefit during the correction.
📈New trading signals📈 have been added to https://t.co/j2kBYXIYSv
Unlike last time, there is plenty of potentially interesting opportunities.
For example 🛢️#Brent crude oil🛢️, ⛽ICE #Gasoil⛽, 🐄#Cattle🐄, 🧵#Cotton🧵, ☕#Coffee☕ and 🍫#Cocoa🍫#OOTT $BNO $COW $JO $BAL $NIB pic.twitter.com/9Blei87CV3
— SpreadCharts.com (@SpreadChartsCom) May 15, 2021
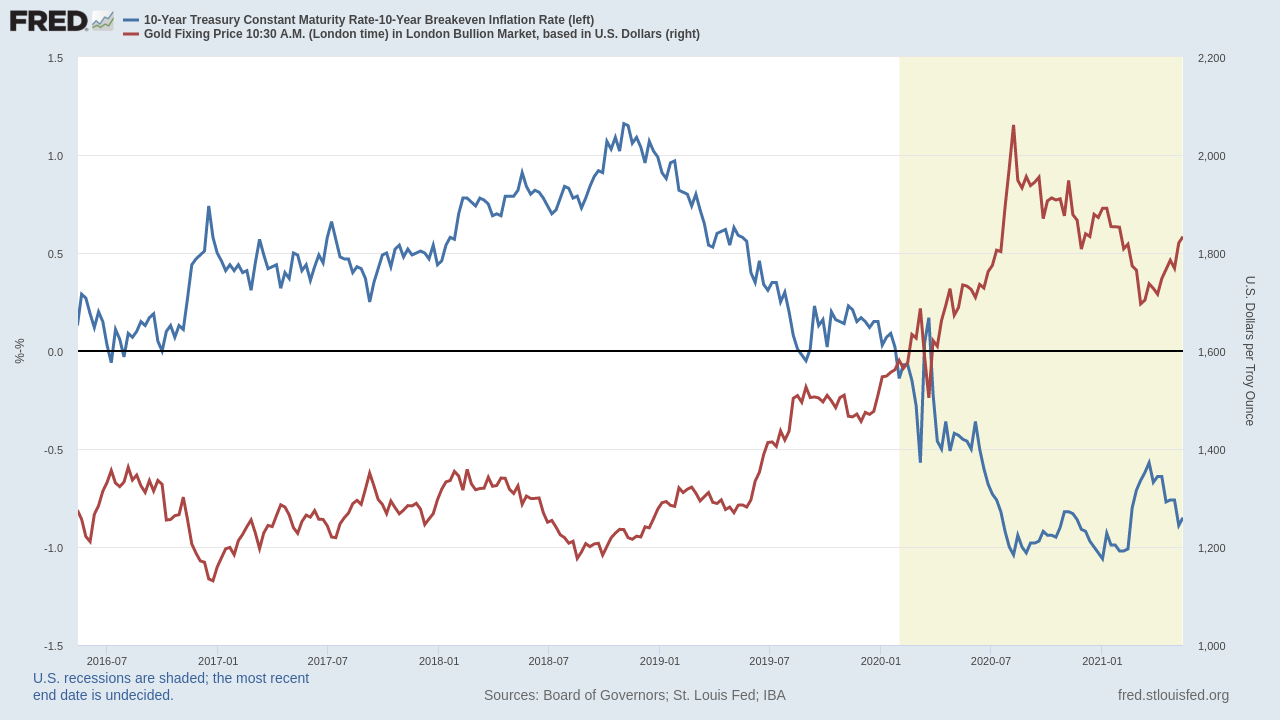
On a more fundamental note, we continue to like gold. We don’t like it as much as we did at the beginning of March when we nailed the bottom in gold and miners with a single-day precision, but we still like it. It may sound surprising because gold is often hailed as an inflation protection asset and shall therefore suffer if inflation pressures take a pause. However, that’s not exactly true. In fact, gold price inversely follows the real rates, rather than inflation alone. And if bonds rally, gold may rise even if inflation slows down.
Although it’s not as good setup as it was in March, we like it from the long-term perspective. We’ve been repeatedly saying we’ll most likely see a new all-time high this year. And we stick to our prediction.
Check out these great articles as well
New data: Sector indices
Our software is already established well beyond commodity market analysis. Stock indices, currencies, and even...
Read moreWhat’s new in the SpreadCharts app?
It’s been a few months since we launched the new version of the SpreadCharts app....
Read moreA major new version of the app is here
Today, we’re excited to show you the major new version of the SpreadCharts app that’s...
Read moreLiberation Day!
Tariffs are arguably the dumbest part of Trump’s agenda. Yes, the goal makes perfect sense,...
Read more