My new position in the cocoa market
I have opened a bull spread in cocoa. Despite the spread being low-risk, my position isn’t large for several reasons.
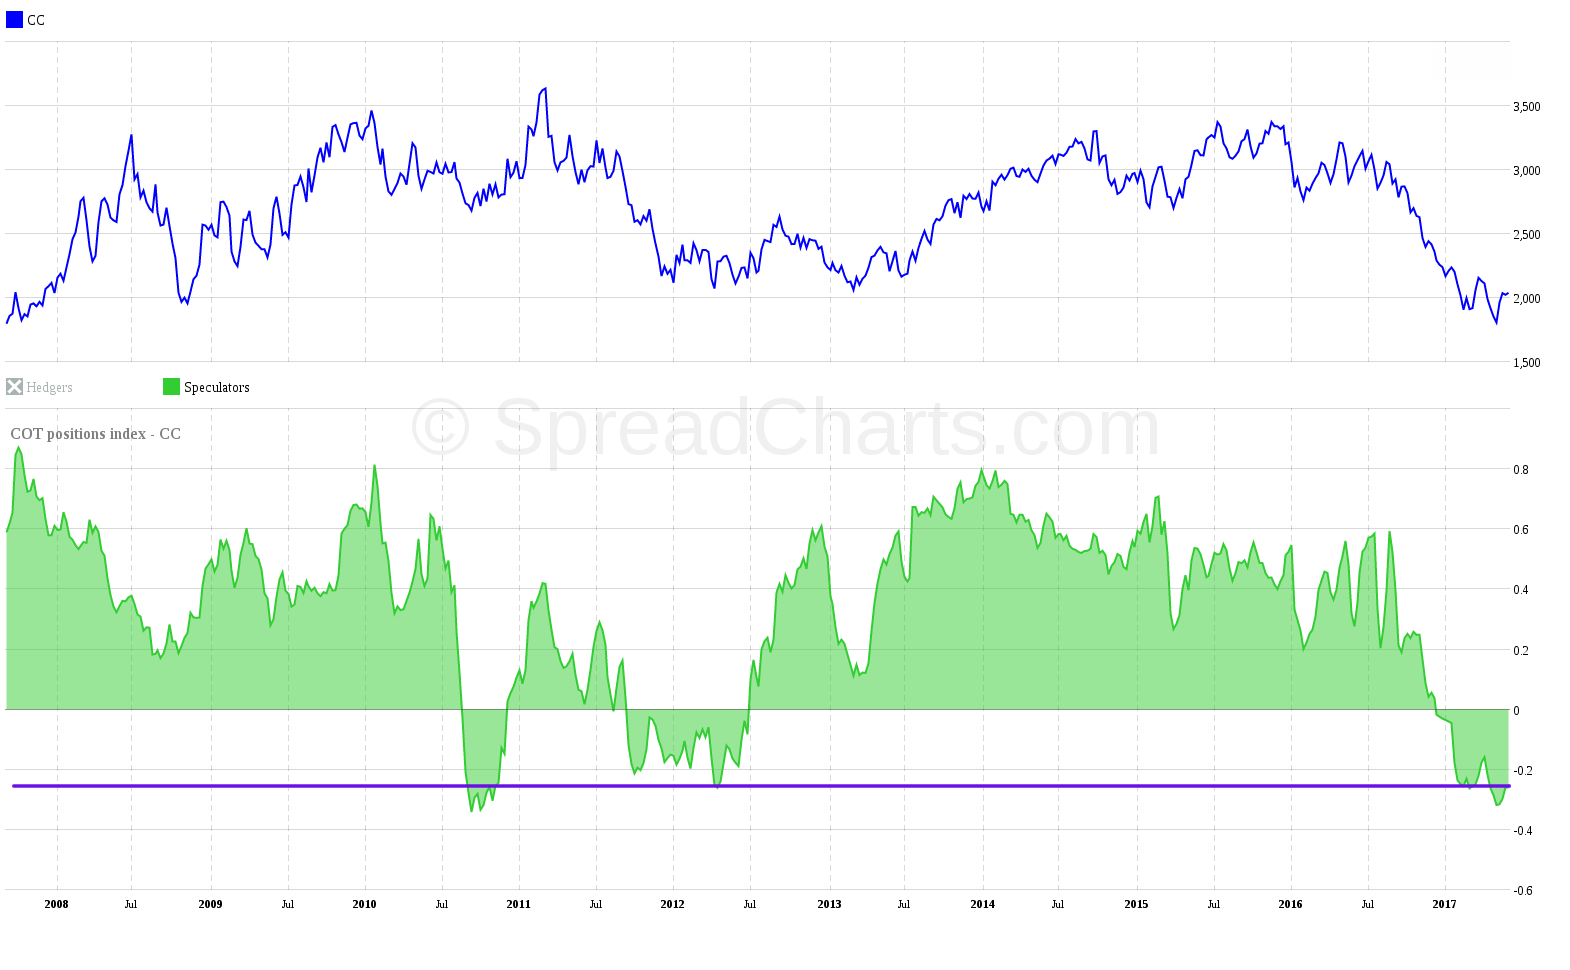
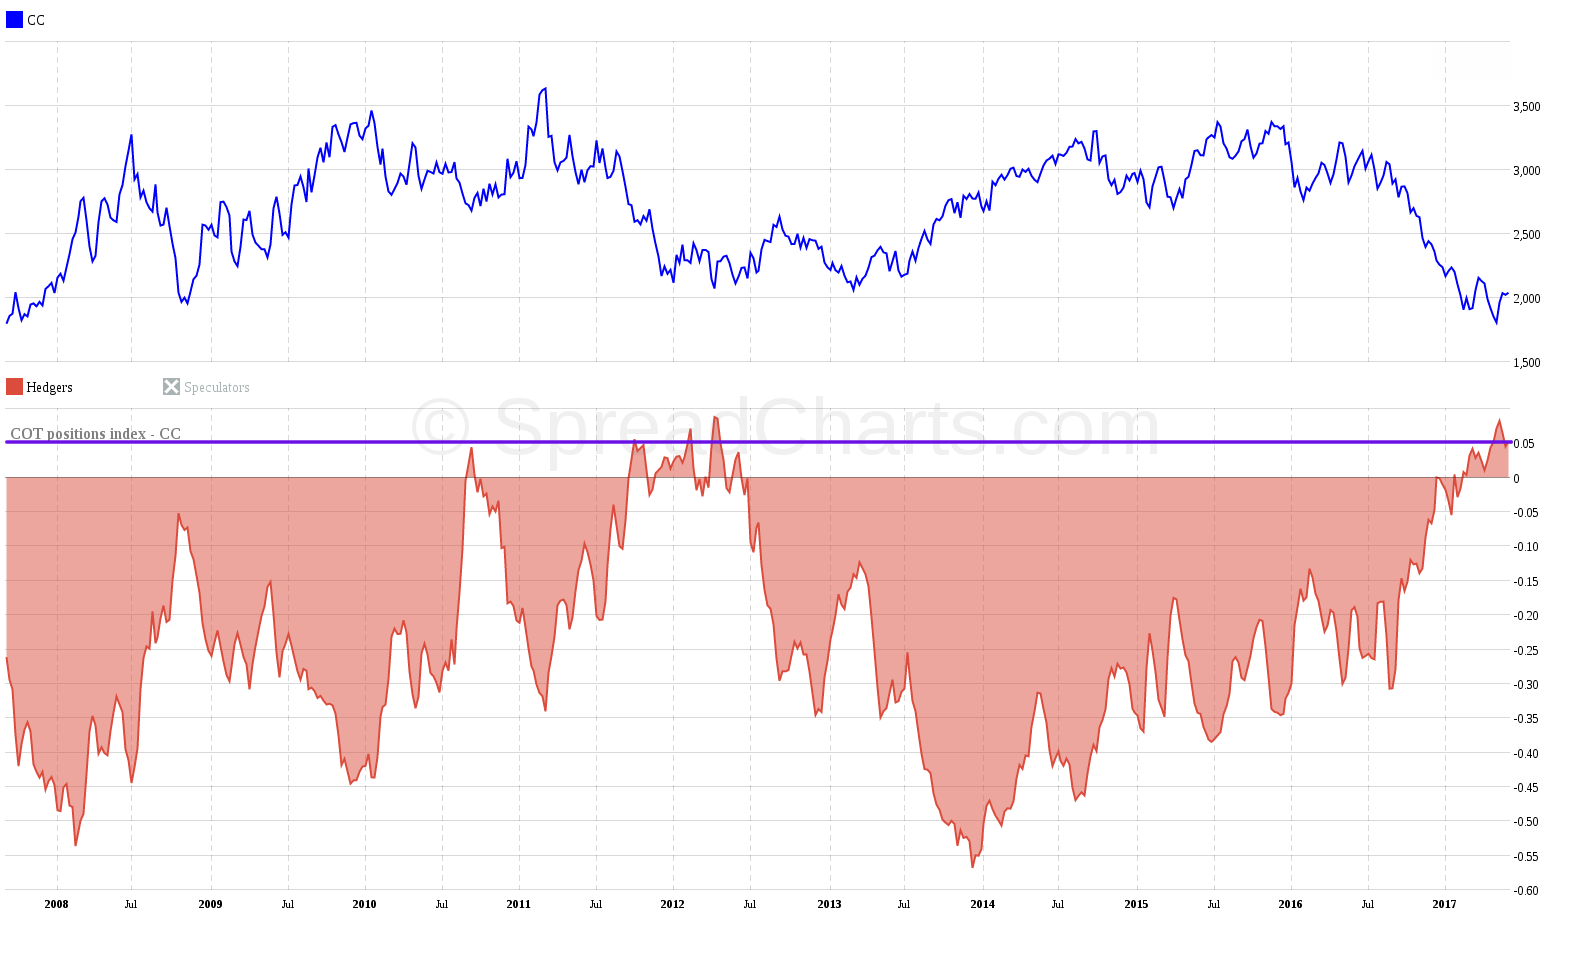
Let’s comb through the charts. I always begin with the Commitments of Traders analysis. It’s like a screening filter which tells me whether the opportunity is worth my time. The COT is clear in cocoa – all indicators give us a picture of a heavily oversold market. The positions of the hedgers and large speculators are stretched too far from normal levels.
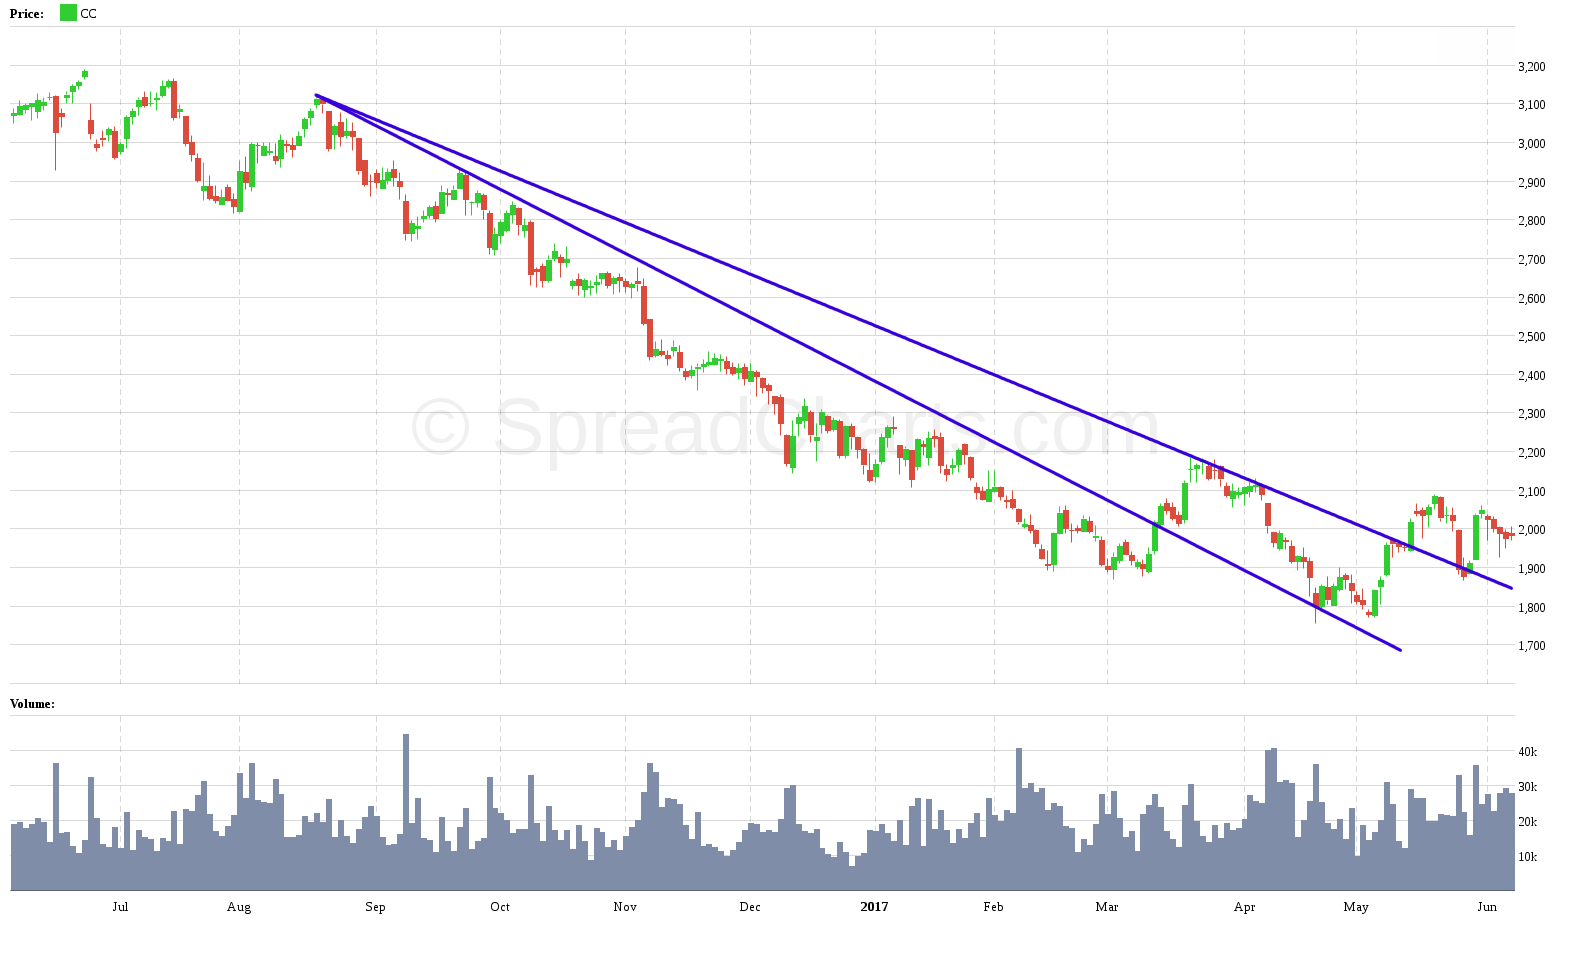
So the market has passed my first condition. Let’s take a look at technical analysis. The next chart shows breakouts of two descending trendlines and their subsequent retest from above. This is a typical pattern during major trend reversals.
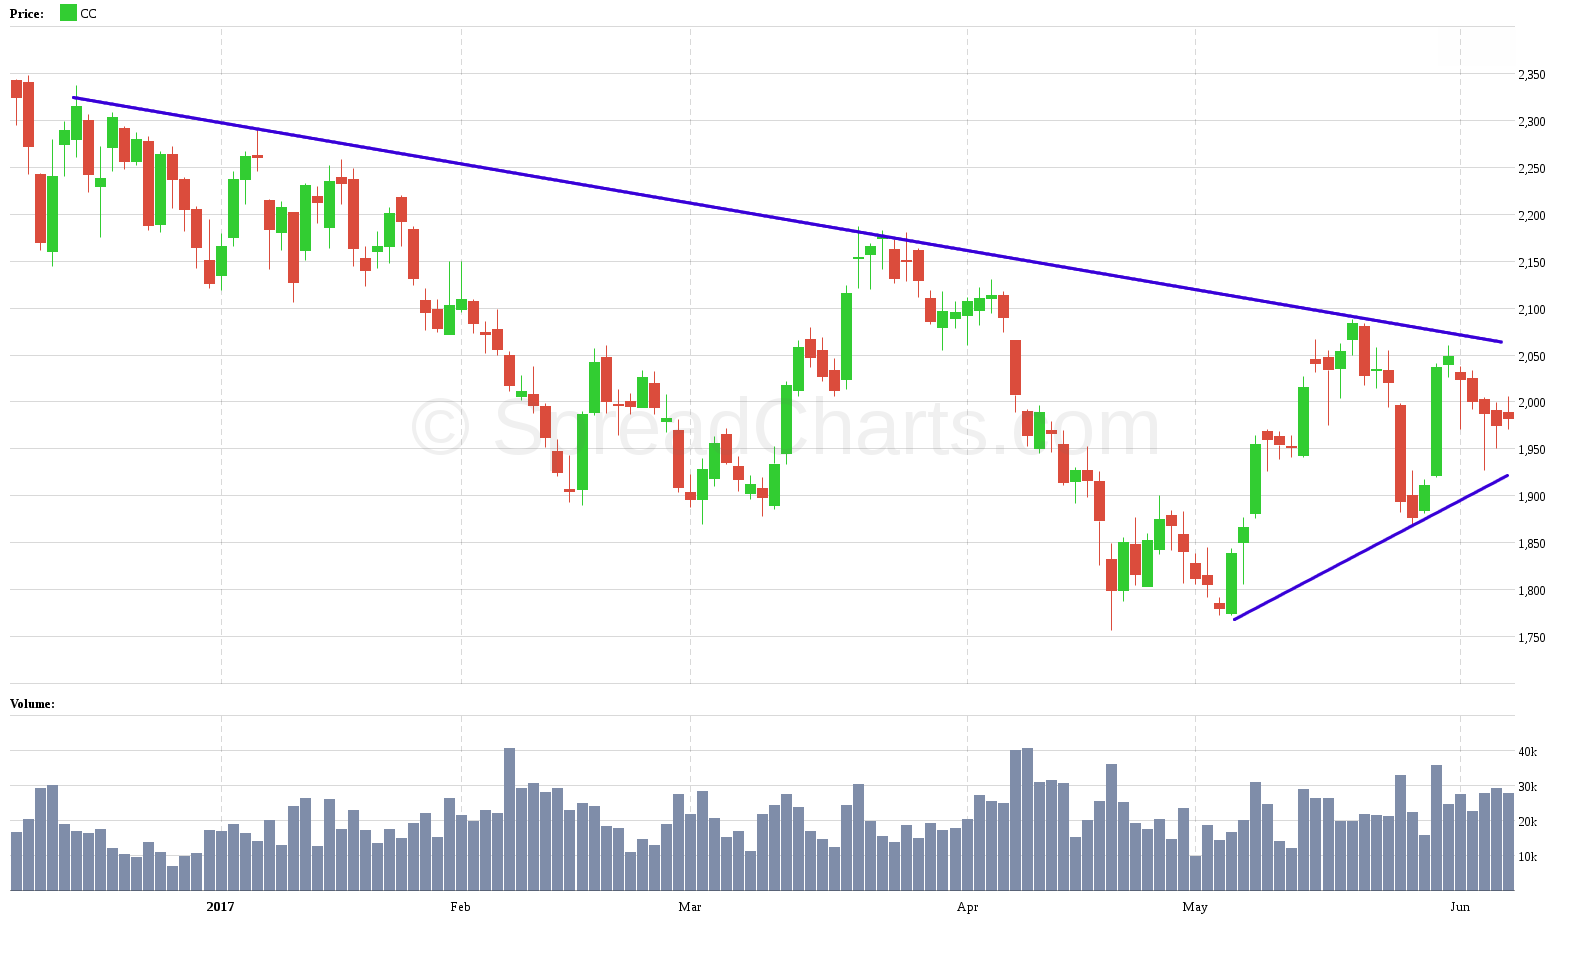
I’ll watch for a break above the falling trendline from last year and then for the resistance at $2100.
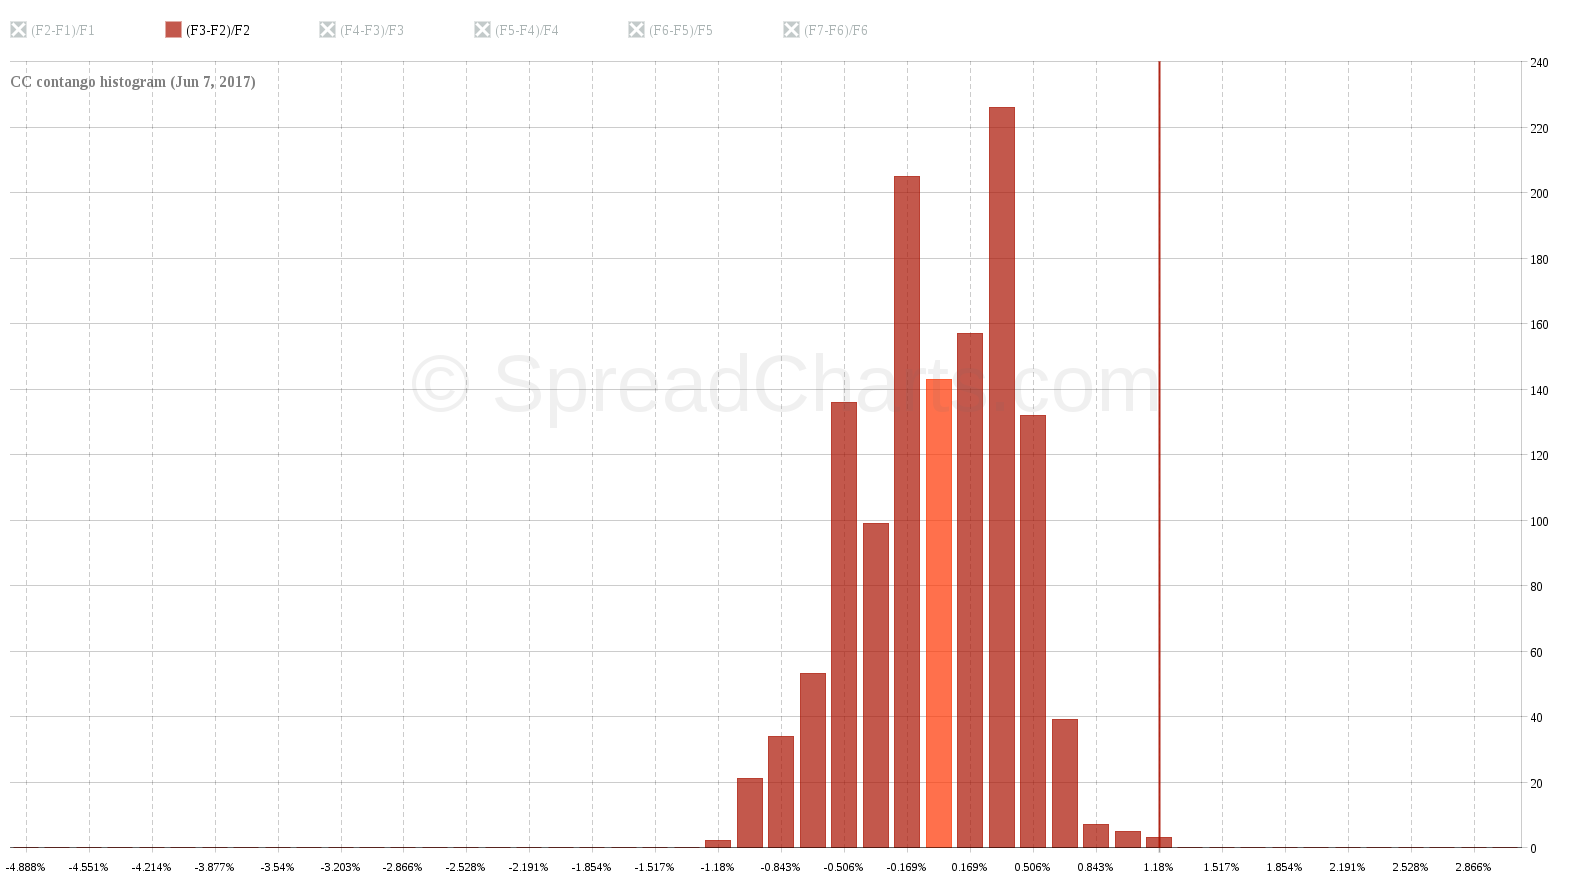
An important item on my checklist is the term structure analysis. When I look at the 5-year contango histogram, the contango isn’t clearly prevalent, as is the case in most commodities. Bull spreads, therefore, have a decent chance of success in cocoa. Check it out in the chart of the contango histogram between the 2nd and 3rd expiration month.
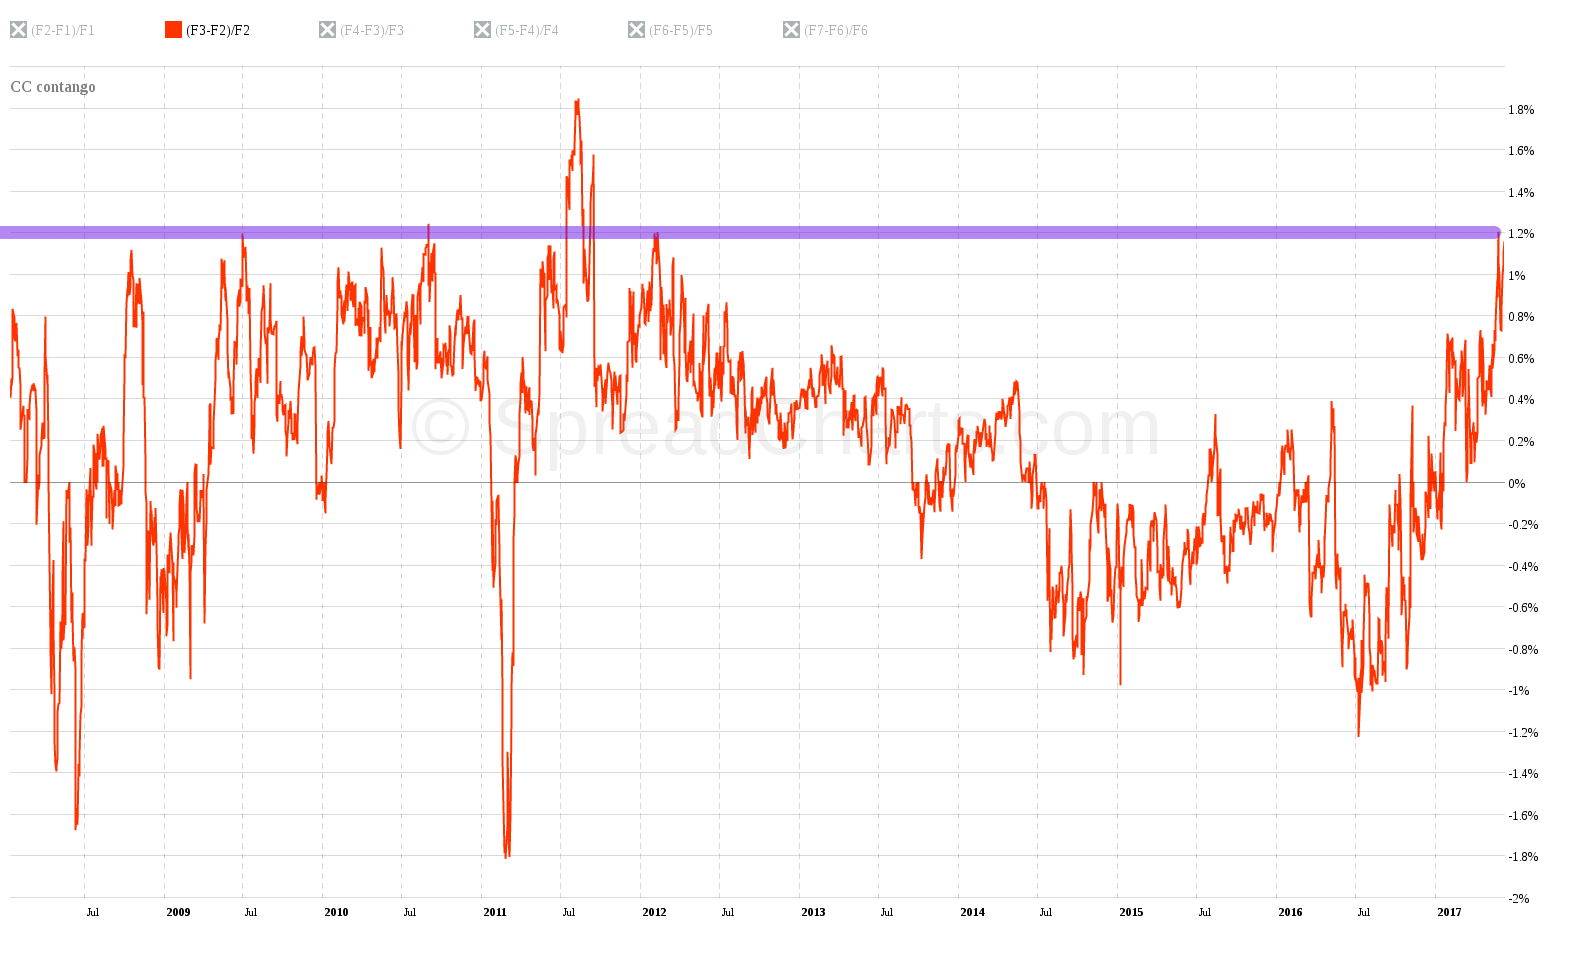
The second interesting thing about term structure is the extremely high level of contango. The current reading is the highest for the last 5 years and with exception of a brief episode in 2011, it’s the highest in 10 years.
Has the contango reached its limit this time? Well, that’s not guaranteed. The strong contango is also the biggest drawback of this opportunity. It’s continuously pulling bull spreads lower. Moreover, there are also fundamental reasons like strong supply from running harvests.
On the other hand, the good supply may be already priced in. Cocoa at these prices can attract a lot of buyers. The market usually turns when everybody thinks it’s oversupplied. That’s the reason why I decided to go long with an adequate position, so I have my risk under control.
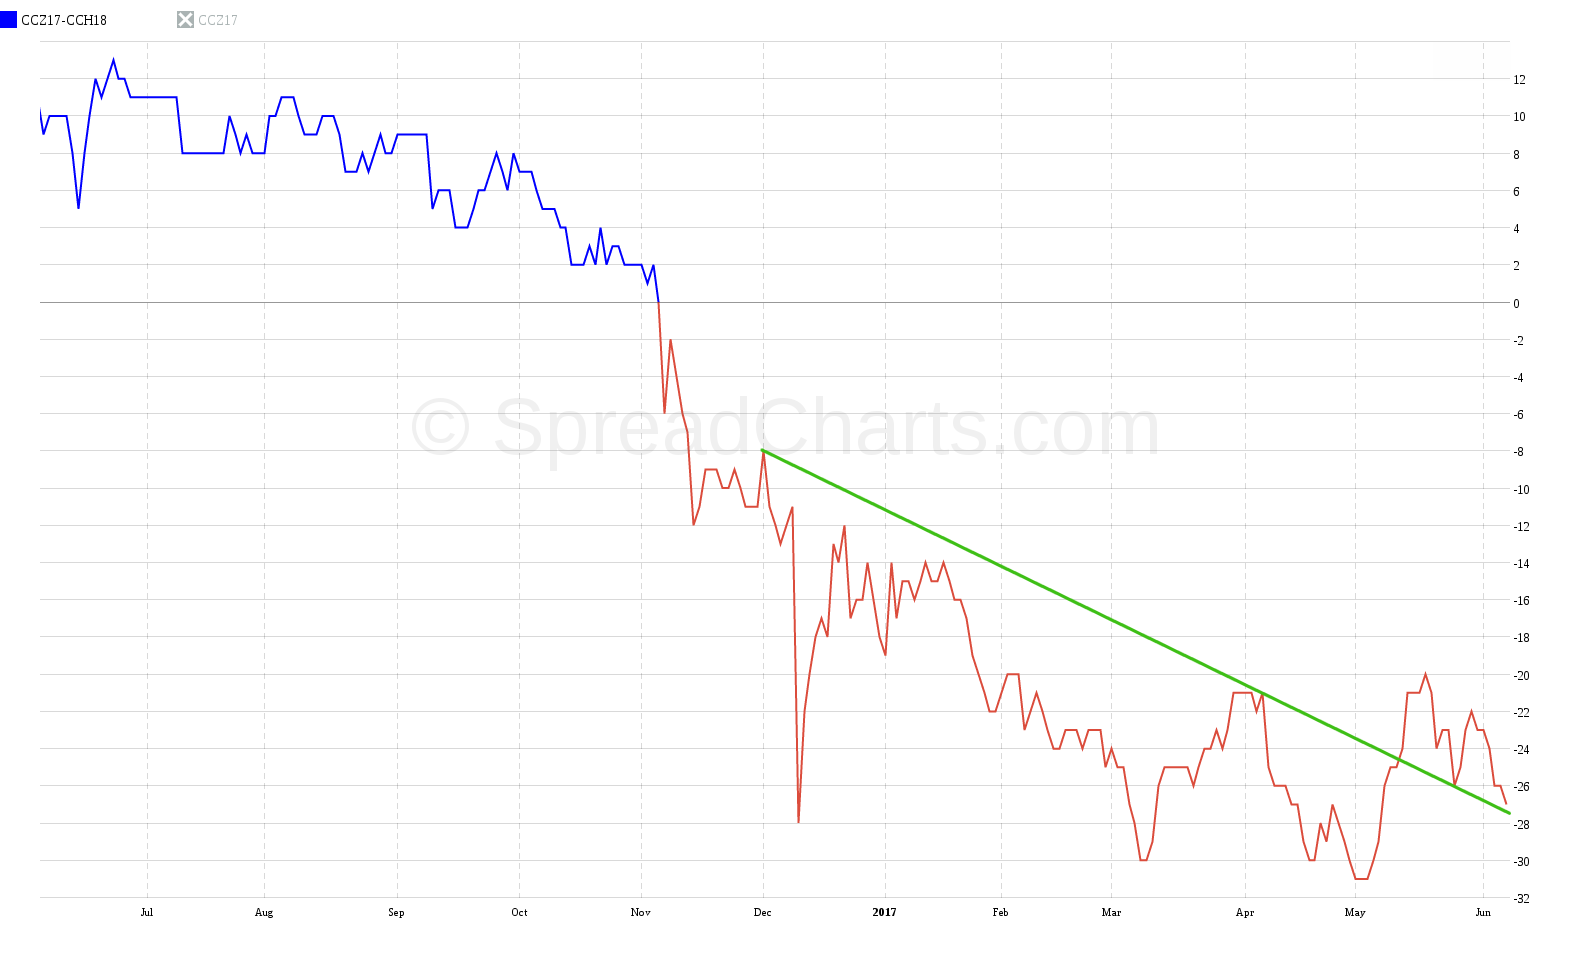
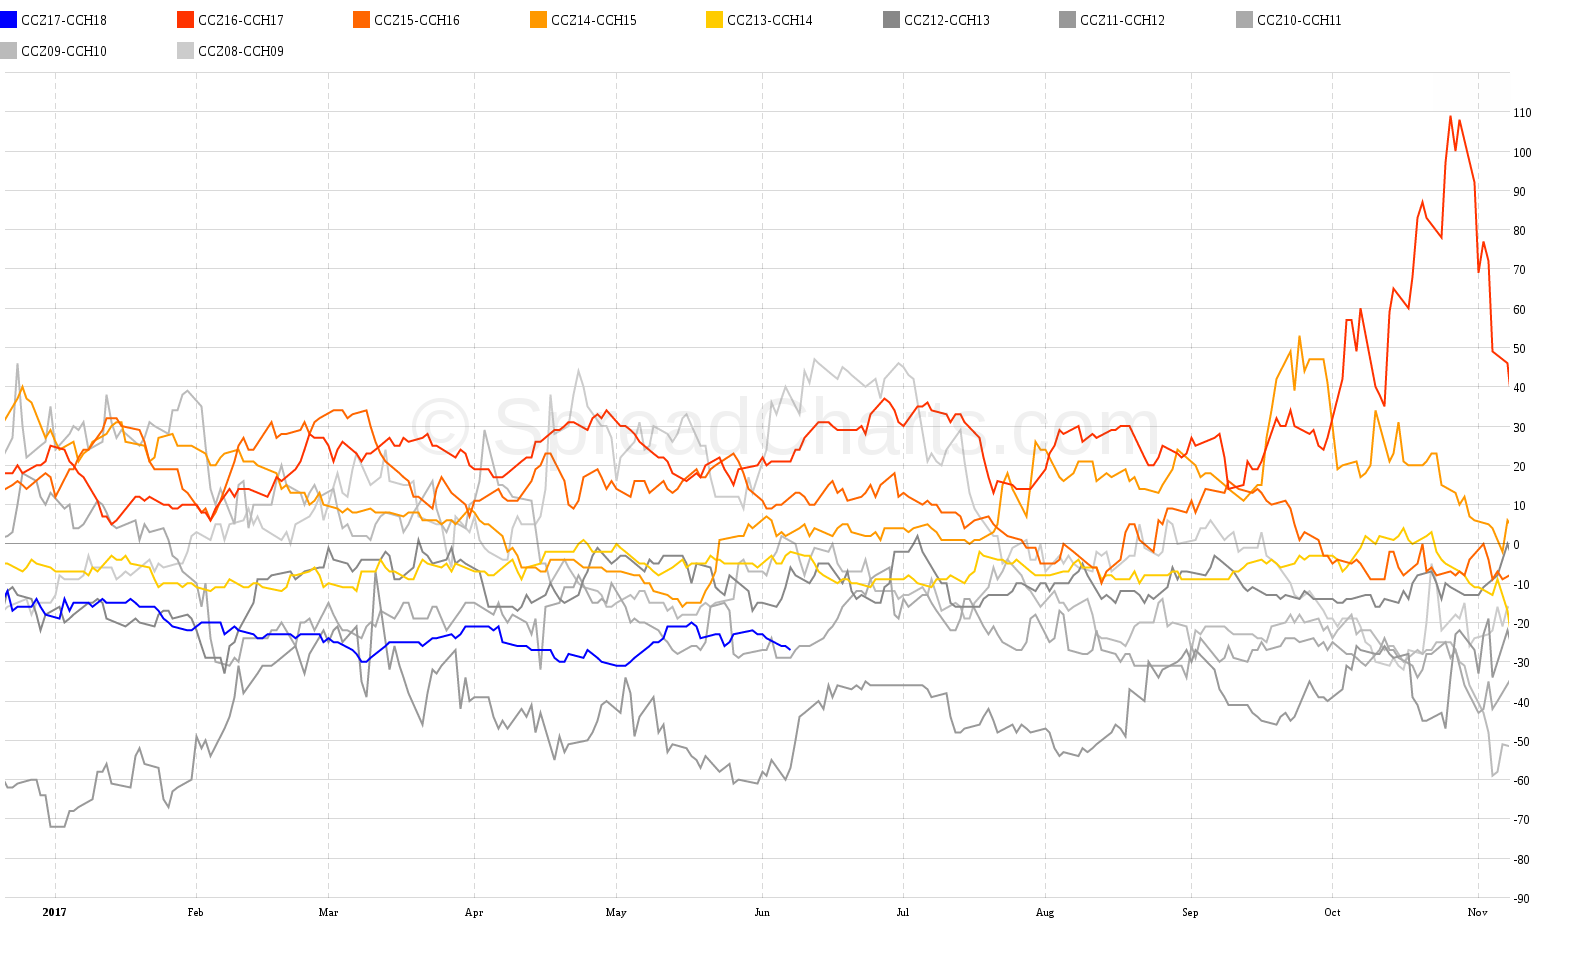
I picked a more distant bull spread, which I have also analyzed in the previous Spread report – CCZ17-CCH18. It’s apparent the spread is no longer in a downtrend. It has come through consolidation and looks poised to move higher.
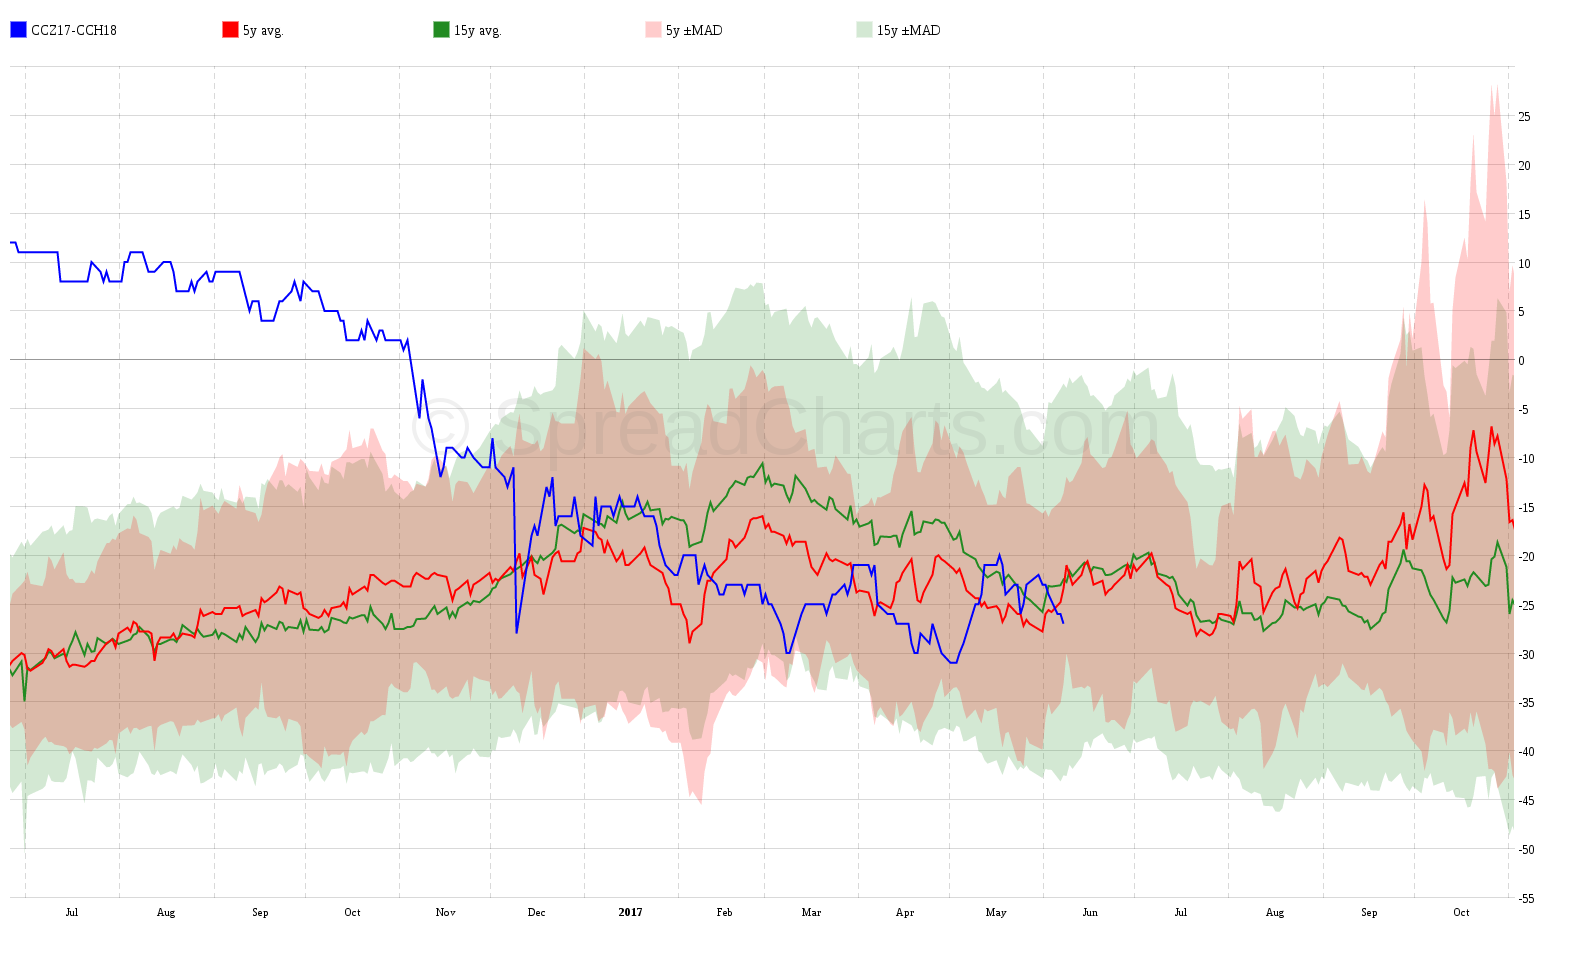
Finally, let’s check the seasonality. Both 5 and 15 year mean curves show no significant trend. Variance channels also don’t expand, so I’d call the seasonality rather neutral.
Detailed seasonality chart confirms this thesis as there are no abnormal moves during the period. The spread usually oscillated between -$30 and +$30.
To sum it up, this is not a sure trade by any means. Even if cocoa turns up, there’s no guarantee the spread will bring a sizeable profit due to strong contango. On the other hand, I have a small account and this is a great way to trade this opportunity with low risk.
Check out these great articles as well
New data: Sector indices
Our software is already established well beyond commodity market analysis. Stock indices, currencies, and even...
Read moreWhat’s new in the SpreadCharts app?
It’s been a few months since we launched the new version of the SpreadCharts app....
Read moreA major new version of the app is here
Today, we’re excited to show you the major new version of the SpreadCharts app that’s...
Read moreLiberation Day!
Tariffs are arguably the dumbest part of Trump’s agenda. Yes, the goal makes perfect sense,...
Read more