New chart: Continuous price
We’ve launched a long-awaited feature today. Previously, if you wanted to analyze the long term behavior of a specific futures contract or a spread, you would probably use the stacked seasonality chart on SpreadCharts. This, however, had some drawbacks.
First of all, individual years are stacked on top of each other. That’s great for analyzing seasonal patterns but less convenient for getting the dynamics of the contract/spread over the years. Second, you’re limited to just the past ten years. Otherwise, the stacked chart would become unreadable. If you want to get a longer-term history, you would have to chart a more distant contract combination. That’s inconvenient and prevents comparison between various decades.
These drawbacks are gone from today. You’ll find a new chart type under the Price group in the action select:
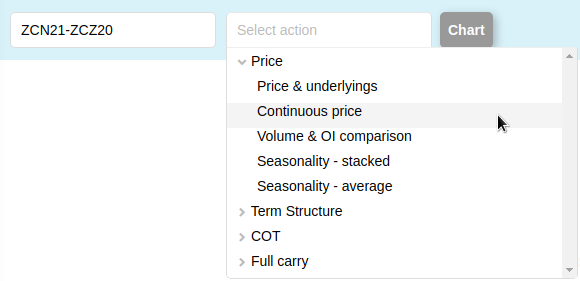
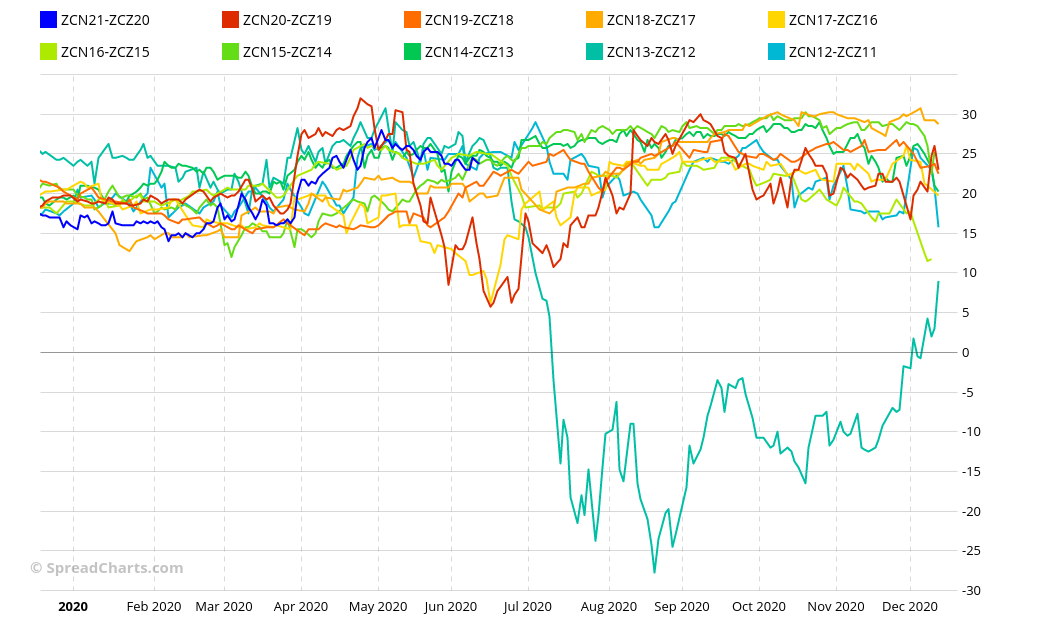
The Continuous price chart will show the evolution of the price of your contract or spread over many decades. Although the default zoom is set to the last 2 years, you can easily display a longer period using the zoom panel on the right side. The contracts are placed one after another once the active contract expires. Only the last year of data for every contract (expiration) is used, even though the life of the contract is greater than one year. On the daily time frame, each contract is highlighted by a different color that repeats after a decade. The current contract is always blue which is the only color that is not repeated in the palette. You can easily identify ticker of historical contracts by moving the cursor over the desired line.
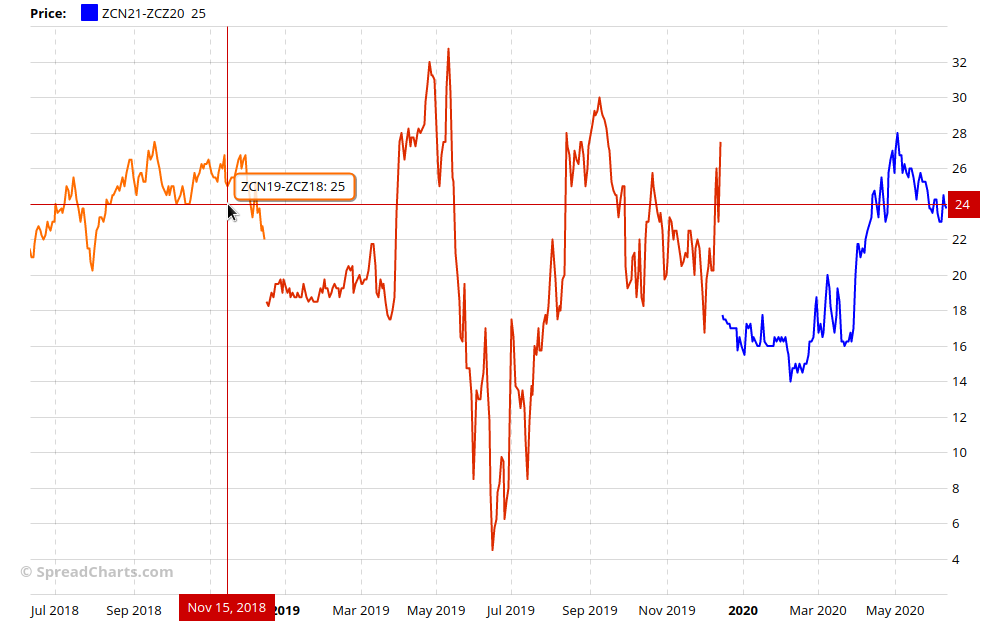
If you display a longer period (more than 2 years of data), the chart will switch to candlesticks which offer better readability for very long periods (years up to decades). Just keep in mind it’s made of closing (settlement) prices and ignore daily open/high/low prices as they can be less reliable for decades-old data and are not even relevant for long term analysis.
Difference between the continuous price and continuous contracts
You might wonder what’s the difference between the Continuous price of some futures contract or spread and the price chart for the continuous contract. Let’s make this straight.
The continuous contract has a ticker such as NG1 for example. It’s composed of a commodity symbol and a number determining the order of the selected contracts at the time they were plugged into the series. There is no expiration month in the ticker. It’s an artificially created time series. You can’t trade a continuous contract unless you roll over your futures position every month. Doing that would cost you something due to contango which is not reflected in the continuous contract.
Moreover, continuous contracts in every charting service will look slightly different as there’s no preferred roll methodology (i.e. the rule determining the exact time to switch to the next contact). For example on SpreadCharts, you can choose from the rollover at the last trading day (default) or by maximum open interest. I recommend you to watch the video tutorial in the app for more details.
Therefore, the continuous contracts are useful for long term analysis of a particular commodity and are not intended for trading decisions.
On the other hand, the new Continuous price chart can be displayed only for an actual futures contract or spread, i.e. something you can really trade. Although even the continuous price is an artificial time series made of many contracts connected together, it’s more relevant for making trading decisions on particular futures/spread combinations as only the contracts with the same expiration month are plugged into the continuous price.
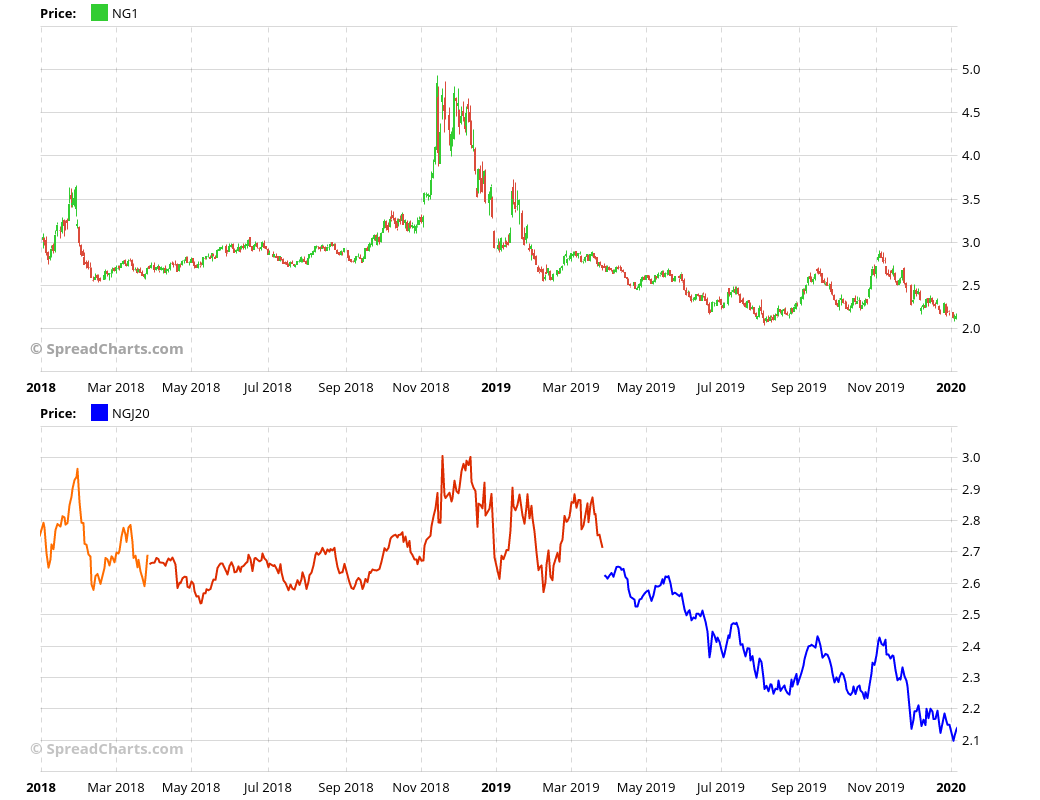
Let me demonstrate it on the following chart. On the top subchart is the price of the first continuous contract (NG1). On the other hand, the bottom subchart shows the continuous price for the NGJ20 futures contract. Focus on the spike in November 2018. When the price of NG1 spiked to $5, the continuous price for NGJ20 spiked only to $3. The discrepancy is caused by the fact that the active contract for NG1 at that time was NGZ18, while the active contract for the continuous price of NGJ20 was NGJ19. While NGZ18 falls into the winter heating season, NGJ19 is in the offseason. Demand for natural gas during winter can be so much higher compared to offseason, that prices of those two contracts can behave like two different commodities. This is overlooked by beginner traders who make wrong trading decisions about a particular futures contract or spread based on irrelevant continuous contracts.
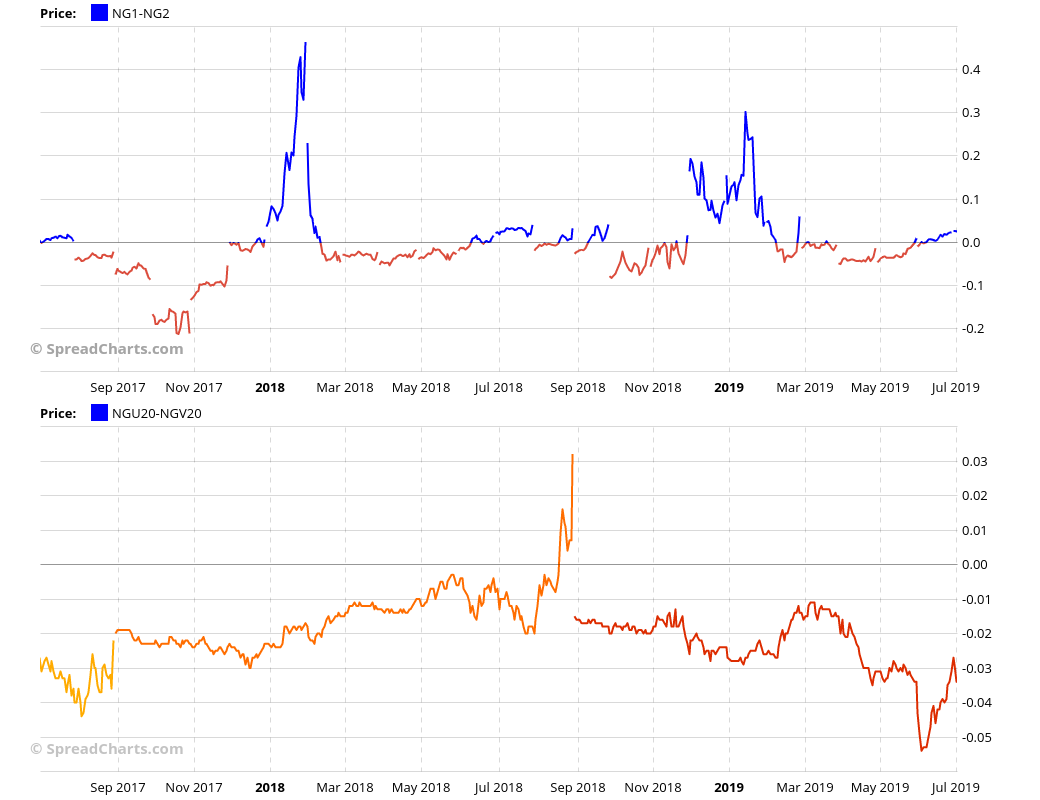
These differences get amplified when you try to compare a particular spread with the spread of continuous contract. Here’s the comparison between the continuous price of NGU20-NGV20 and NG1-NG2. Although technically they are both 1-month wide bull spreads, they look dramatically different.
Luckily, you can now visualize a long term history for a particular futures contract or spread thanks to the new Continuous price chart.
Check out these great articles as well
New data: Sector indices
Our software is already established well beyond commodity market analysis. Stock indices, currencies, and even...
Read moreWhat’s new in the SpreadCharts app?
It’s been a few months since we launched the new version of the SpreadCharts app....
Read moreA major new version of the app is here
Today, we’re excited to show you the major new version of the SpreadCharts app that’s...
Read moreLiberation Day!
Tariffs are arguably the dumbest part of Trump’s agenda. Yes, the goal makes perfect sense,...
Read more