New data for two energy markets
It’s been more than a year since I promised you data for more markets. I didn’t expect it to take so long, but I will start to deliver on this promise today.
Our problem was that whenever we wanted to make any changes in the market data, we had to do it manually in the database. That was bothersome. Before adding any new data, I wanted to rewrite this part of the SpreadCharts app completely. And I have finally found time to do it this year. Now we can easily add new data and automatically rebuild the entire market data database without a tedious manual process.
How does this benefit you, our users? Well, in two ways. You can finally expect additional markets in the app. We start today with two energy markets that are crucial not just for traders but, frankly, for everyone in Europe in these difficult times.
We are looking forward to adding more data later this year. There is no longer any technical obstacle. We just have to sort out the licensing with the exchanges. I plan to do it over the summer, so that’s when you can expect more data.
The second benefit is the improved quality of the data. This is a neverending issue as there is no perfect data source. Even the data feeds directly from the exchanges contain numerous errors. Our data was superior to other sources before, as we compiled it from multiple sources. Now, we pushed it to an even higher level. I implemented automatic checks that cleaned the historical data. Then I defined manual corrections for known areas of corrupted data. Of course, the quality is not the same for every commodity. But I’m pretty sure you won’t find better data anywhere today.
But now to the new data that we added today.
Dutch TTF Gas
|
|
|
| Contract name | Dutch TTF Gas futures |
|
|
|
| Exchange | ICE Europe |
|
|
|
| Ticker | TFM |
|
|
|
| Expiration months | F, G, H, J, K, M, N, Q, U, V, X, Z |
|
|
|
| Currency | EUR |
|
|
|
| Contract size | 1MWh/day |
|
|
|
| Point value | €1000 |
|
|
|
| Tick size / value | 0.005 / €25 |
|
|
|
This commodity has been in the spotlight since the summer of 2021. Energy prices are rising everywhere, but it’s a totally different level of craziness in Europe. And the natural gas prices are the main catalyst of this trend.
This used to be a niche market known only by experienced energy traders. Not anymore. This contract is cited by mass media nearly every day, and even people outside of finance follow its price. They know it will determine their electricity and heating bills.
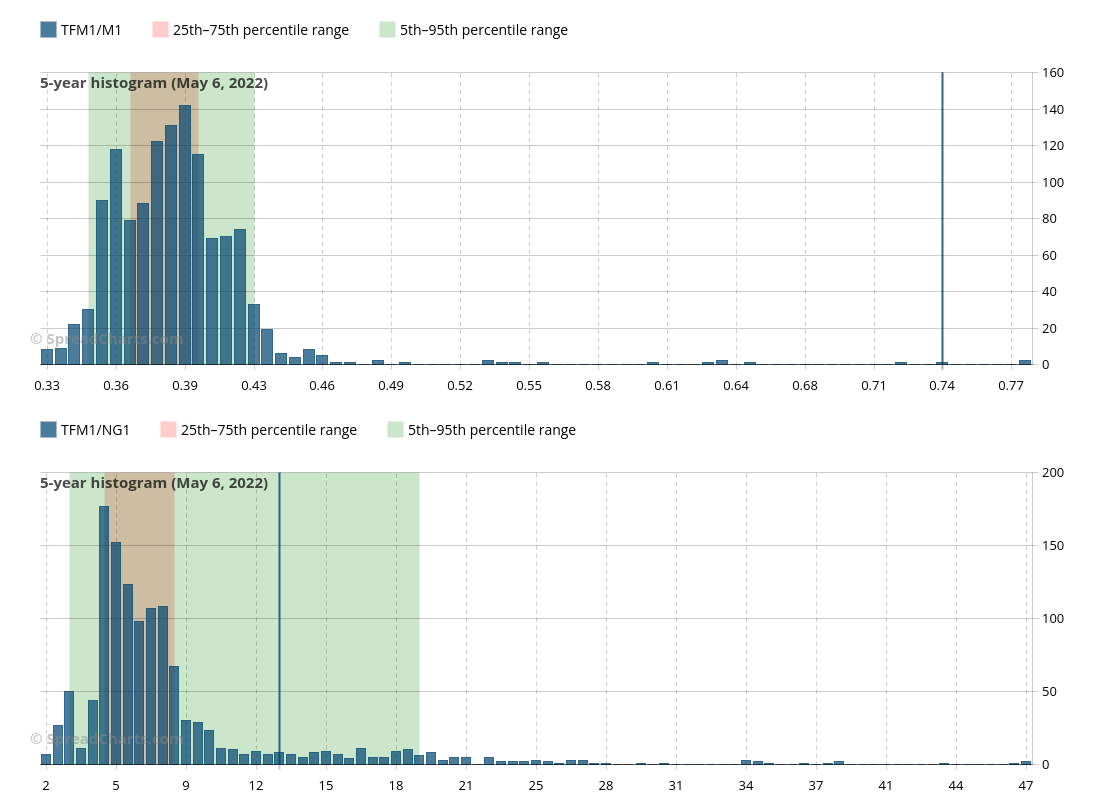
You can now access it in the SpreadCharts app. Unfortunately, there is no COT data for TTF Gas. But besides COT, you can benefit from all the powerful tools in the app like seasonality studies, term structure dynamics, and even various distributions using the histogram chart.
This comes in handy, especially for intermarket strategies that institutions often play with this commodity. For example, the histogram studies for ratios between the Dutch and UK Gas and Dutch vs Henry Hub contract are below.
EU Allowances
|
|
|
| Contract name | EUA futures |
|
|
|
| Exchange | ICE Europe |
|
|
|
| Ticker | ECF |
|
|
|
| Expiration months | H, M, U, Z + other less liquid |
|
|
|
| Currency | EUR |
|
|
|
| Contract size | 1000 tons of CO2 |
|
|
|
| Point value | €1000 |
|
|
|
| Tick size / value | 0.01 / €10 |
|
|
|
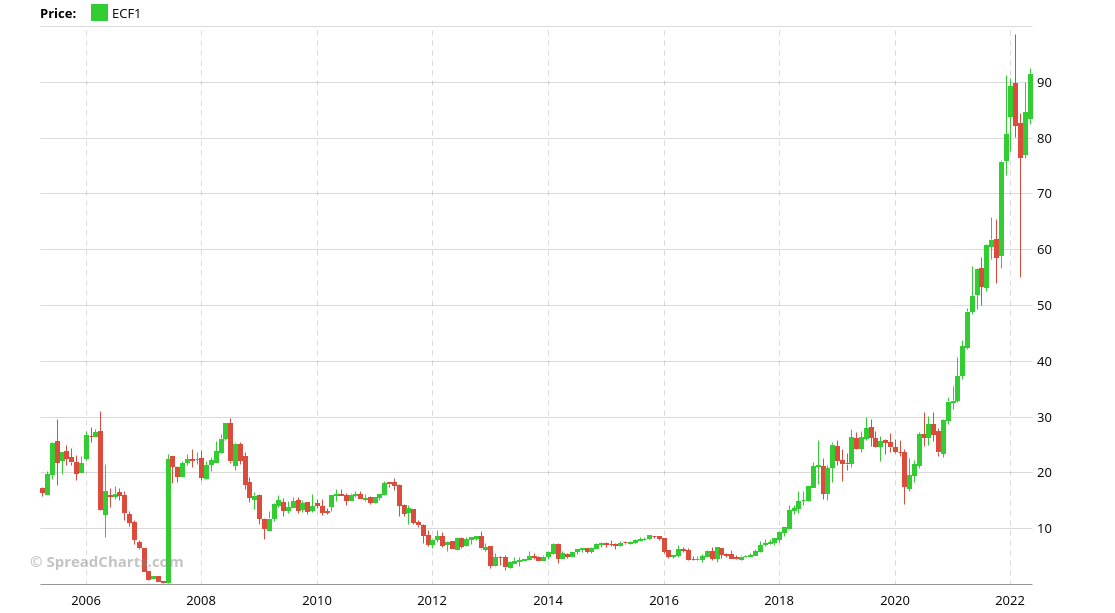
Do you think you have never heard about this market? Of course, you had, maybe not under this name. These are carbon credits in the European Union Emissions Trading Scheme. This mechanism was devised in the EU to lower CO2 emissions by penalizing dirty energy sources like coal.
I won’t delve into details, but it’s sufficient to say that some people blame this scheme for worsening the current energy crisis. Everybody has an opinion. But the truth is, EUA future rallied hard over the past year. Big money is being made or lost in this market. And even if you won’t trade it directly, it’s definitely a good idea to keep an eye on this market. That’s especially true for energy traders.
Speed-up of continuous charts
Besides the new data, we made a slight change to continuous charts, which means both continuous contracts like ZC1 and continuous prices of specific contracts like ZCZ22.
These charts are extremely demanding on your browser rendering performance. They also take a lot of memory. A single chart would not be a problem. But if you have several of them opened at the same time, it can pose problems to people with older PCs or slower tablets. According to our stats, 95% of the time, our users look only at the past five years of data. Of course, we mean just the continuous price charts, not specific contracts.
So, we decided to further limit the maximum number of years to be displayed on these continuous charts to 30 years. That’s not a significant drop from around 42 years which was the previous limit. Yet, it would speed up the app significantly on older hardware. And if you wish to look at continuous prices from more than 30 years ago, you can easily do so using continuous price chart for a specific contract with expiration well in the past.
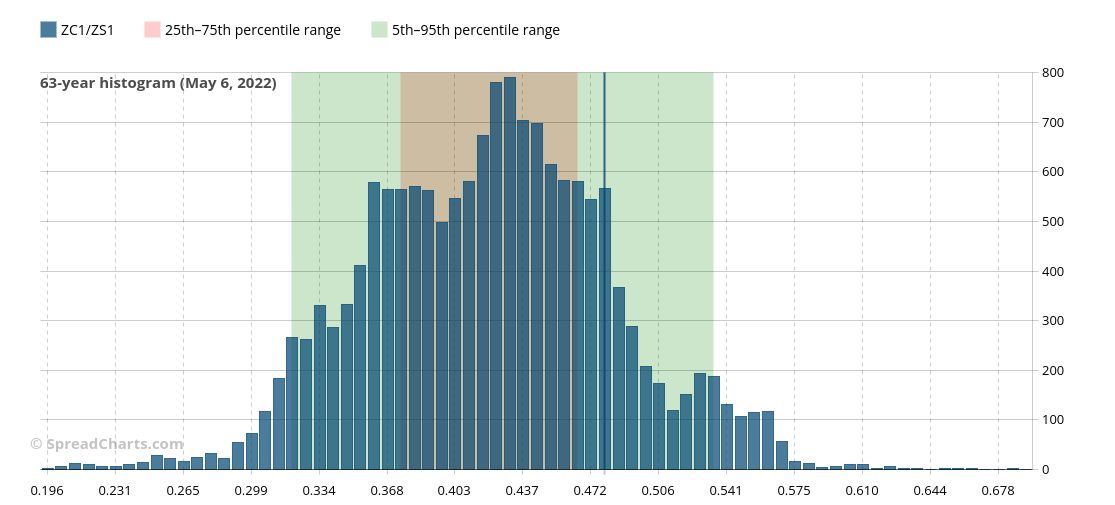
On the other hand, we dropped all limits from the histogram chart. The continuous price data serves as input for the histogram, so it was also limited. No more! This chart is, in fact, much better for studying really long-term data, as the common price charts become cluttered and hard to read above 20 years.
For example, take a look at 63 years of the corn/soybean ratio. If this is not cool, then I don’t know what is. This chart can literally print money, as our premium users witnessed last fall.
If you want to access the new data in the app, we recommend you to clear cookies and temporary files in the browser. In most cases, however, reloading the app using Ctrl+Shift+R will suffice. Moreover, let us know if you encounter any problem in the app or with the data. Although it is not visible on the front, we made major changes and might have missed some details.
Check out these great articles as well
New data: Rates and electricity
As promised, we’re adding new data to the SpreadCharts app. Importantly, the goal is not...
Read moreNew data: Sector indices
Our software is already established well beyond commodity market analysis. Stock indices, currencies, and even...
Read moreWhat’s new in the SpreadCharts app?
It’s been a few months since we launched the new version of the SpreadCharts app....
Read moreA major new version of the app is here
Today, we’re excited to show you the major new version of the SpreadCharts app that’s...
Read more