The ultimate valuation tool
Another upgrade of the SpreadCharts app is here. Don’t forget to clear your browser cache in order to load the new version of the app. In some cases reloading the app using Ctrl+Shift+R is sufficient.
Here are just some of the new features and improvements:
- when you now click on a ticker of a trading signal, it will open the corresponding price chart in a new tab under Charts
- you can now select the roll method for the histogram of continuous contracts (by LTD or max OI)
- new Tools button in Charts that contains a date selector and other less-used controls
- dozens of minor bug fixes and optimizations
- the highlight of this release – improved continuous price and histogram charts
The old continuous price and histogram
The most significant changes happened in the continuous price and histogram of specific futures contracts and their combinations like ZCZ21, ZCN22-ZCZ21, 100*(ZCN22-ZCZ21)/ZCZ21, etc. The charts for continuous contracts like ZC1, 100*(ZC2-ZC1)/ZC1 are not affected.
A continuous price chart for a specific futures contract or spread was previously constructed by taking the last year of data for each expiration year and concatenating them together in one chart. Individual expirations were distinguished by color on a daily timeframe (2-year zoom and below). Here’s a good example for the ZCN22-ZCZ21 spread:

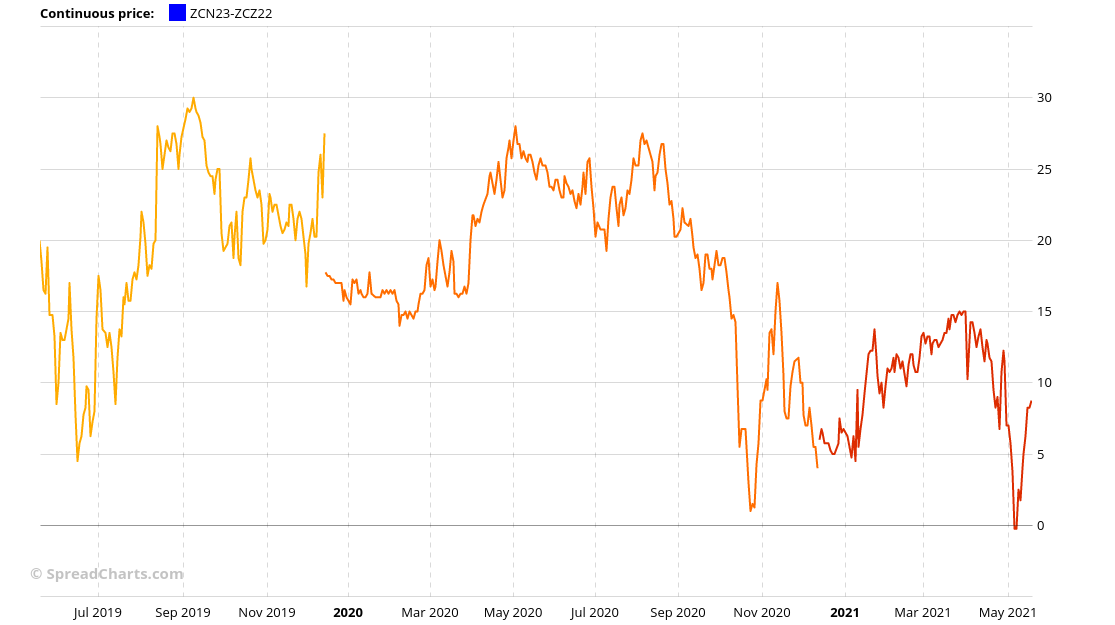
This method of connecting individual contracts made sense. We selected the last year of life of each contract because it’s most liquid exactly during this period. However, it put some constraints on what you can analyze with these charts. When you entered a futures contract or spread that had more than one year till expiration, the price of the selected contract did not appear in the chart at all. Instead, the line ended with the previous expiration year. Here’s an example. The old continuous price chart for distant spread ZCN23-ZCZ22. The last price is, in fact, for the spread ZCN22-ZCZ21 (red curve).
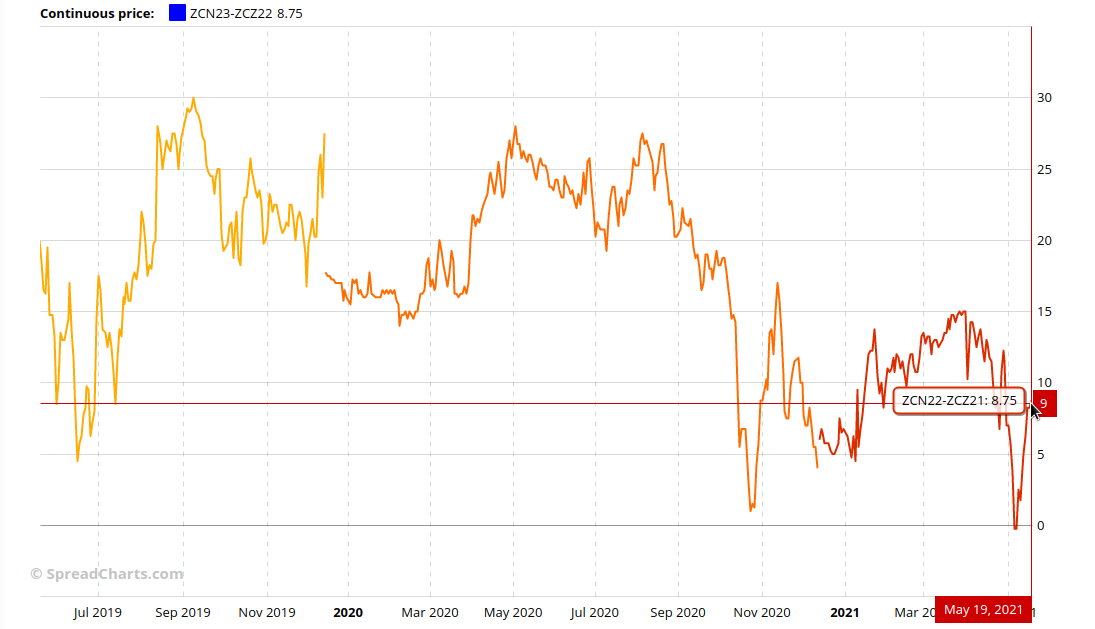
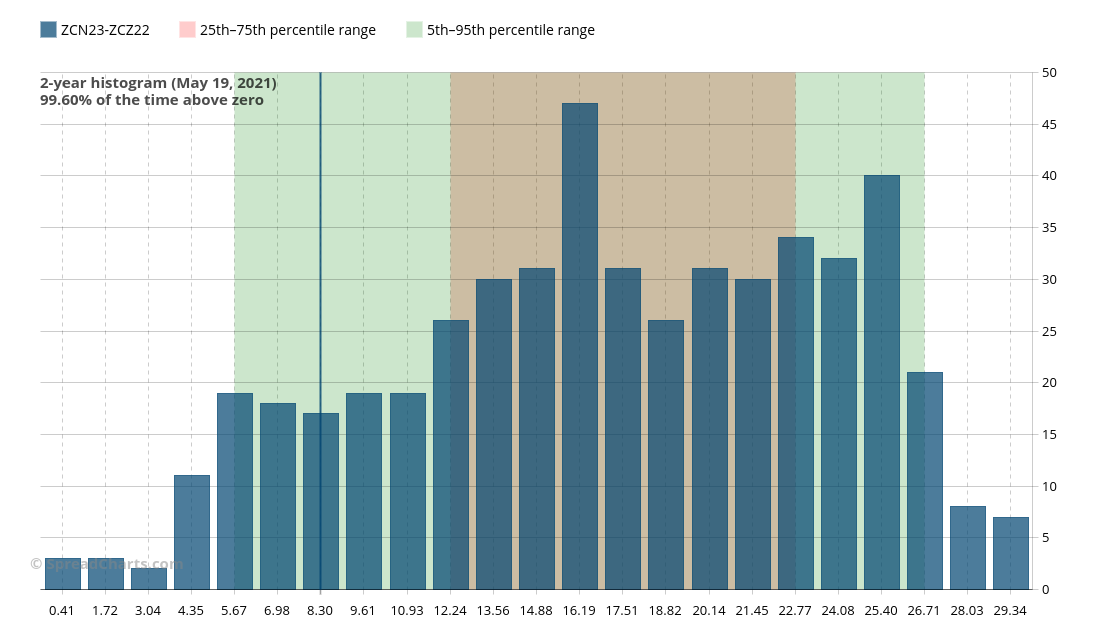
That phenomenon was especially troublesome for the continuous histogram. This chart just takes the input from continuous price for specific contracts and makes the statistical analysis. Here’s the chart for the same spread ZCN23-ZCZ22. The problem is that the last price here (vertical blue line) corresponded not to the ZCN23-ZCZ22 spread but to the ZCN22-ZCZ21, i.e. the last value on the previous continuous price chart. However, this fact is not apparent to a user when he looked just at the histogram and did not check the continuous price chart.
In the end, you were not able to perform valuation analysis of contracts or spreads with more than one year till expiration. This was bothersome especially for spreads, because unlike outright futures, it’s not uncommon to trade even very distant combinations of contracts.
Nevertheless, this was not an error. The continuous price for a specific contract (and therefore also histogram) was defined to show each contract year’s last year of life. We could have easily put the price of the entered spread (e.g. ZCN23-ZCZ22) instead of the last data point from continuous price (e.g. ZCN22-ZCZ21) as the last price in the histogram. But that would not be a correct approach. Comparing the price of a spread that has, for example, a year and a half till expiration to a distribution of historical data points with a mean time to expiration of precisely half a year would be like comparing apples to oranges. The conclusion would not be sound and could lead to incorrect trading decisions.
The improved continuous price and histogram
I decided to make the histogram practical even for the valuation of distant spreads. And of course, to do it right.
When you do any statistical analysis, you’re trying to balance two things that naturally run counter to each other. You want your data set to be as large as possible. The more data you have, the more relevant and robust the results of your analysis are. On the other hand, you want the data in your dataset to be as relevant and precise as possible. You wouldn’t want to fill your data set with bad data, just for the sake of its size. The problem is, there is no easy way to determine the perfect balance between the size of the data set and the quality, or rather inferiority, of the data you let in the data set.
Let’s go to the point. I decided to change the selection method for the continuous price of specific contracts and, therefore, also the histogram. Instead of the last year of each contract/spread, it will select a year of data symmetrically around the current date for each contract. An example is better than thousand words.
Here’s the continuous price chart for ZCN22-ZCZ21 spread. The top chart is the new calculation, while the bottom chart is the old way. The current date is May 19th, 2021. The new method basically grabs 6 months of data from the future and 6 months of data from the past for each expiration year. That’s why the data set is symmetrical around the current date and corresponding dates for each previous year.
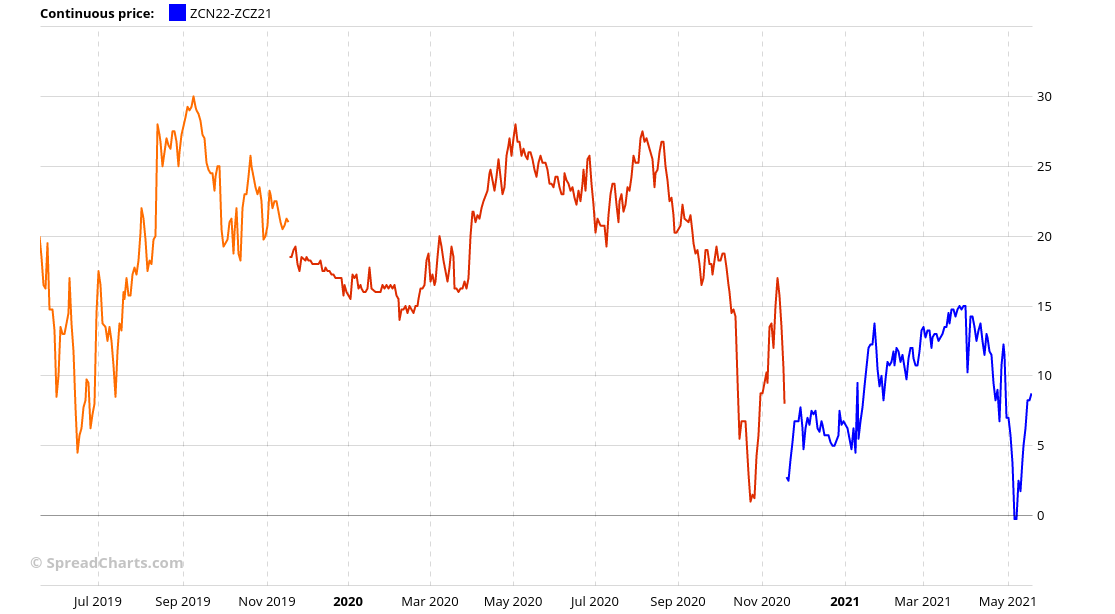
The difference is not significant for the previous example. However, that’s because the ZCN22-ZCZ21 has just 7 months till expiration, so the contract window is shifted by just about 1 month compared to the original method. But the difference will become more apparent on more distant spreads. Here’s an example of the ZCN23-ZCZ22 spread. The new calculation is once again on the top chart.
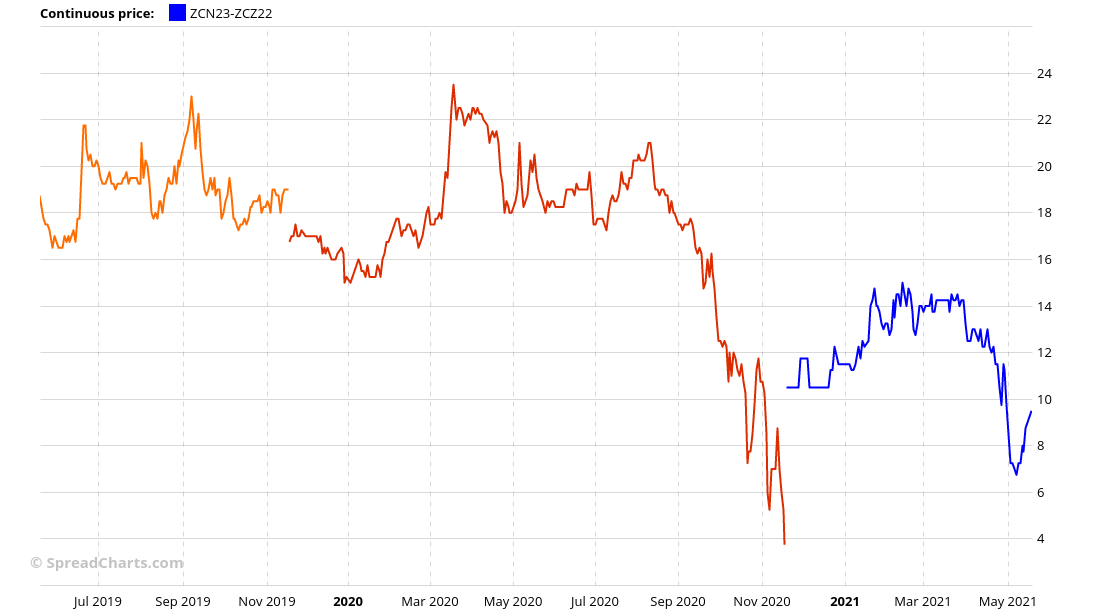
Now it looks like a totally different chart. First of all, you can see the blue line on the new chart. That’s good because that’s the price for the spread you truly entered. The ZCN23-ZCZ22 spread has roughly 19 months until the near leg’s expiration, which is a lot. The data for each contract year is selected +/- 6 months around the current year. In this case it means the app selected data between 25 and 13 months till expiration for each expiration year. I recommend you to check the data yourself in the app.
In case you enter a contract/spread that has less than 6 months till expiration, the algorithm selects the last year of life of the contract/spread because there is no data beyond the expiration. This is the only way how to get a continuous time series for contracts/spreads with less than 6 months to expiration.
Conclusion
The new selection method has a few key advantages over the old one.
You always get the data of the futures contract/spread you entered. The last value in the histogram will always belong to the entered contract/spread. Therefore, you can make valuation analysis even for very distant contracts/spreads.
The selected data has maximum relevancy to the current value, i.e. the last price. The data is selected +/- 6 months around the current date to expiration for contracts/spreads with more than 6 months till expiration. If you enter a contract with less time to expiration, the last year of life is selected. You get the maximum amount of data with the lowest possible distance from the current value (and therefore the highest relevancy). Win-win.
Is that all? Well, not exactly. There is one more thing. A neat feature that is intended for true power users. I will explain it to you in the next article as I don’t want to overwhelm you with too much information at one time.
Check out these great articles as well
New data: Rates and electricity
As promised, we’re adding new data to the SpreadCharts app. Importantly, the goal is not...
Read moreNew data: Sector indices
Our software is already established well beyond commodity market analysis. Stock indices, currencies, and even...
Read moreWhat’s new in the SpreadCharts app?
It’s been a few months since we launched the new version of the SpreadCharts app....
Read moreA major new version of the app is here
Today, we’re excited to show you the major new version of the SpreadCharts app that’s...
Read more