Trading signals: Questions and answers – Part 1
It’s been several months since we launched the new premium features. The most prominent was the new trading signals generated by artificial intelligence. We received many questions about them, especially regarding how to use them properly. Today, we will answer three of the most common questions that are also the most important.
First of all, I recommend you to read the introductory article I published together with the launch of trading signals. You’ll find there what is the input data, how to interpret the signal strength, and more. Most notably, I emphasize the signals are not an indication to make actual trades. Rather they alert you about trading opportunities in various commodity futures and spreads.
Below are answers to some of your most common questions:
Why the market sometimes fails to move in the direction predicted by the signal?
As I mentioned above, the signals show opportunities in the markets. Many of these opportunities can be in their initial stage and wouldn’t develop into a tradeable opportunity. Luckily, this is where the signal strength can be helpful. Take this long signal on soybeans as an example. The blue curve is the price, and the purple curve is the strength of the long ZSU20 signal.
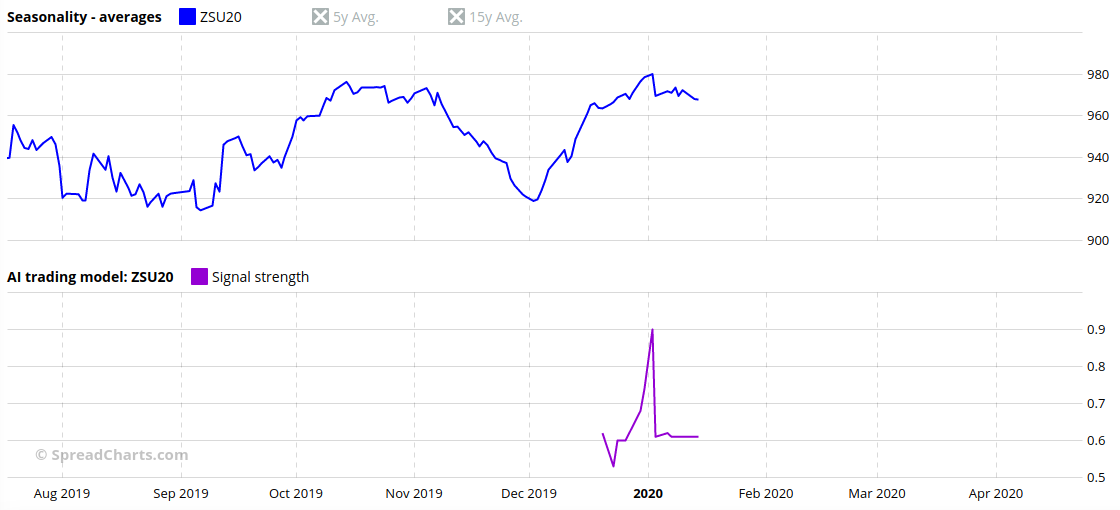
The signal wasn’t even valid as it had failed to reach the 1.0 level. Although it’s not a sharp threshold, and even slightly weaker signals can sometimes work out, this one peaked at 0.9, which is quite below the 1.0 level. Moreover, it dropped sharply to 0.61 after the price of ZSU20 failed to break the previous resistance, and the chart started to resemble a double top. That was a clear sign the opportunity was no longer interesting. However, if the price had broken higher instead of lower, the situation might have been different. That’s a big advantage of our model – it can react to the changing markets in real time.
To be honest, it does not always work so nicely. Sometimes even the strong signals fail. The reasons are described under the Caveats in the introductory article. Simply put, the model may not have the right data, or the markets can suddenly change due to some unexpected news. Moreover, while our model is very powerful, it’s not perfect. Its performance is variable among different commodities and markets. And lastly, the markets can often be unpredictable and irrational.
How to interpret the rising or falling strength of the signal? Should I get out of position if the signal weakens rapidly?
The sole purpose of the signals is to alert you about emerging opportunities. You should have your own system for position management that you fully understand and are familiar with.
Nevertheless, we tried to follow the strong signals long after they dropped below the valid threshold, and there doesn’t seem to be a clear pattern. Sometimes the market flattened or started to move against the prediction soon after the signal dropped to some low level below 0.8. Most of the time, however, this was not the case, and the market moved in agreement with the prediction for a longer period. The signal strength is a function of the expected return and the risk. Even if its value drops, it doesn’t rule out the continuation of a favorable trend. It just means the model no longer considers it a good idea to enter the market with an entirely new (hypothetical) position. Existing (hypothetical) positions can still profit from the trend despite the unfavorable risk/reward ratio.
Because this was the most common question we got from the institutional users of our signals, we developed the following internal guidelines for our own use. Keep in mind these are just theoretical scenarios for our research; we’re putting them here only for educational purposes. We strongly discourage everyone to make actual trades based on our signals.
The signals are NOT a trading system and we DO NOT provide investment advice! What follows is just a thought experiment!
- If the signal fails to reach (roughly) 1.0 and starts falling, the opportunity is no longer interesting. A good example is the long ZSU20 signal I already mentioned above.
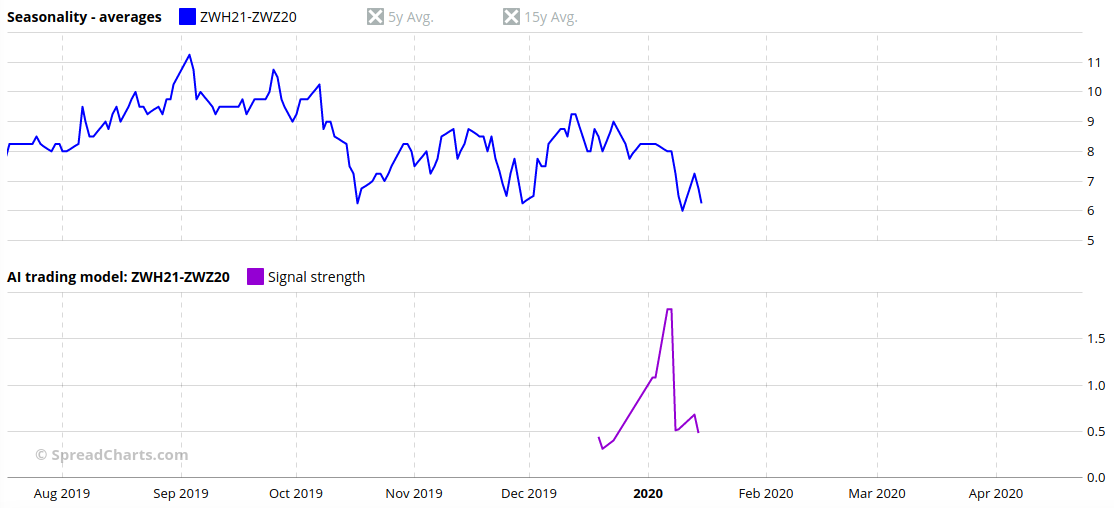
- If the signal is valid (above 1.0) but starts weakening while the market is moving opposite to the predicted direction, interpret this as a warning sign. If it drops below 1.0 while the market continues to move against the signal, it’s a huge warning sign, usually rendering the opportunity invalid. The 1.0 threshold is not applicable in “difficult” markets like energies and financials. A good example of an invalidated opportunity is the following interdelivery spread in wheat:
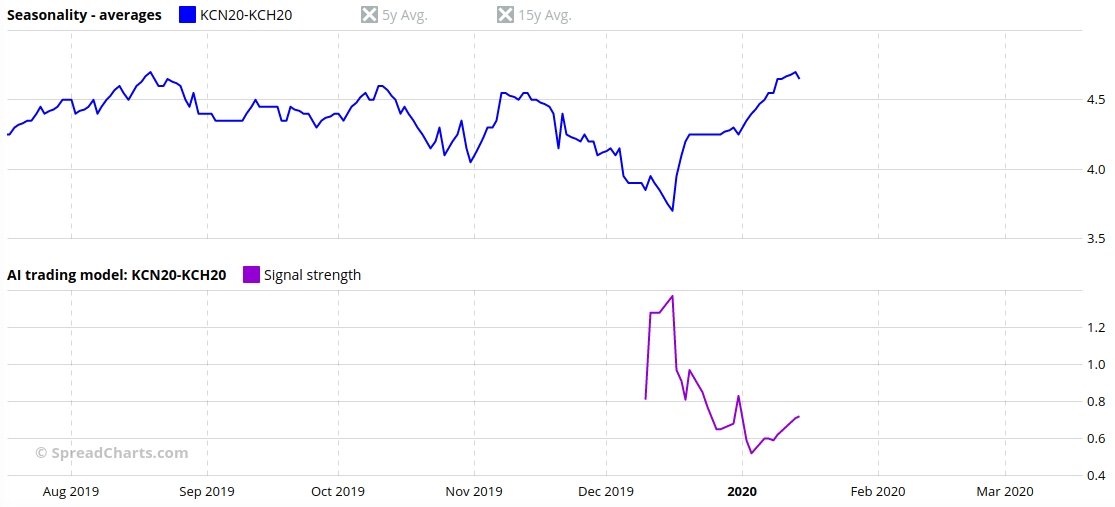
- If the signal was valid, don’t interpret its drop below 1.0 as a push to exit a position if the market is moving in agreement with the prediction. Use other, nonassociated position management tools like S/R levels, trailing stop-loss, etc. However, do not add to the position. An example is this spread in coffee that turned out to be a really great opportunity:
- If the signal is valid and is strengthening, while the market is moving against the prediction, be careful and do not add to the position. It’s either a longer-term signal, and the market will turn around somewhat later, or it’s a failure due to changes in fundamental conditions. This is demonstrated in the short signal on cocoa, where the market moved higher despite the strong prediction:
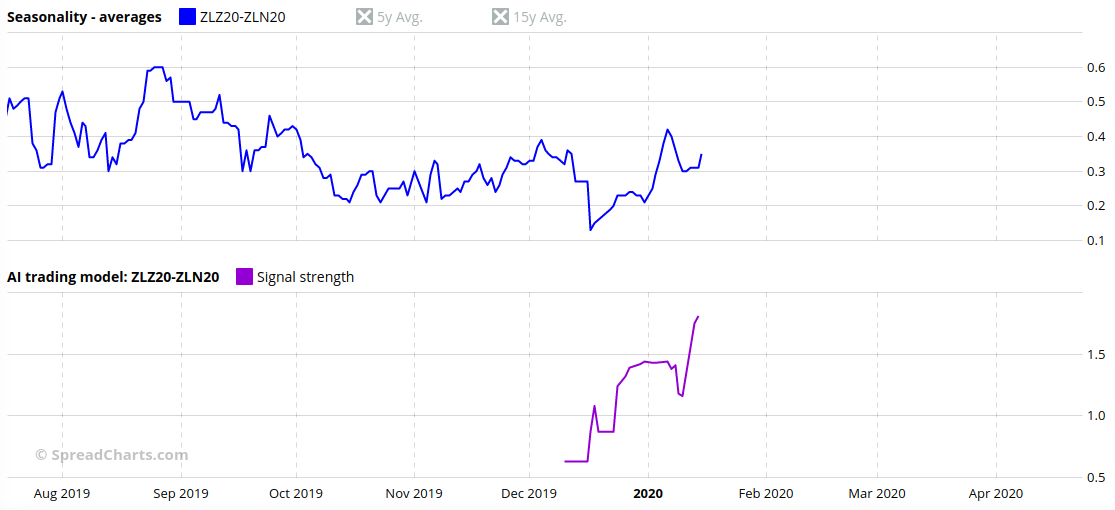
- If the signal is valid and is strengthening while the market is moving in agreement with the prediction, it’s allowed to increase the position. A fine example is the following bear spread in soybean oil:
- If a new signal emerges, which is valid and opposite to the current position, it’s an argument for closing the position. If the signal is not valid, it’s just an important warning sign.

When will the commodity start moving in the predicted direction, and for how long?
Generally speaking, I recommend thinking about the futures and spreads in the trading signals section of the app as medium-term opportunities. Why not long-term or short-term? Well, the short-term movement is mostly noise, while longer-term predictions bear a lot of uncertainty.
The signal strength is calculated from the expected return and risk over the next three months. The exact calculation is, however, quite complicated, and it’s better explained in the introductory article. Generally speaking, the expected movement can happen at any time within these three months and can be either quick and sharp or slow and long. In any case, a strong signal makes the opportunity compelling right now because the risk should theoretically be bearable given the expected return, even if it happens somewhat later. In a practical sense, stick rather to your own risk and money management, as the markets can be (and often are) unpredictable.
Trading signals are generated by a complex machine learning model and are not intended for actual trading. Trading signals are intended for educational purposes only. SpreadCharts s.r.o. (the company) or its representatives bear no responsibility for actions taken under influence of the trading signals or any other information published anywhere on this website or its sub-domains. There is a risk of substantial loss in futures trading.
CFTC Rule 4.41: Hypothetical or simulated performance results have certain limitations. Unlike an actual performance record, simulated results do not represent actual trading. Also, since the trades have not been executed, the results may have under-or-over compensated for the impact, if any, of certain market factors, such as lack of liquidity. Simulated trading programs, in general, are also subject to the fact that they are designed with the benefit of hindsight. No representation is being made that any account will or is likely to achieve profit or losses similar to those shown. All information on this website is for educational purposes only and is not intended to provide financial advice. Any statements about profits or income expressed or implied, do not represent a guarantee. Your actual trading may result in losses as no trading system is guaranteed. You accept full responsibilities for your actions, trades, profit or loss, and agree to hold SpreadCharts s.r.o. (the company) and any authorized distributors of this information harmless in any and all ways.
Check out these great articles as well
New data: Rates and electricity
As promised, we’re adding new data to the SpreadCharts app. Importantly, the goal is not...
Read moreNew data: Sector indices
Our software is already established well beyond commodity market analysis. Stock indices, currencies, and even...
Read moreWhat’s new in the SpreadCharts app?
It’s been a few months since we launched the new version of the SpreadCharts app....
Read moreA major new version of the app is here
Today, we’re excited to show you the major new version of the SpreadCharts app that’s...
Read more