Where’s the bottom on gold?
The markets can be totally unpredictable sometimes. That was, however, not the case in gold recently. In the analysis we published more than a month ago, we concluded:
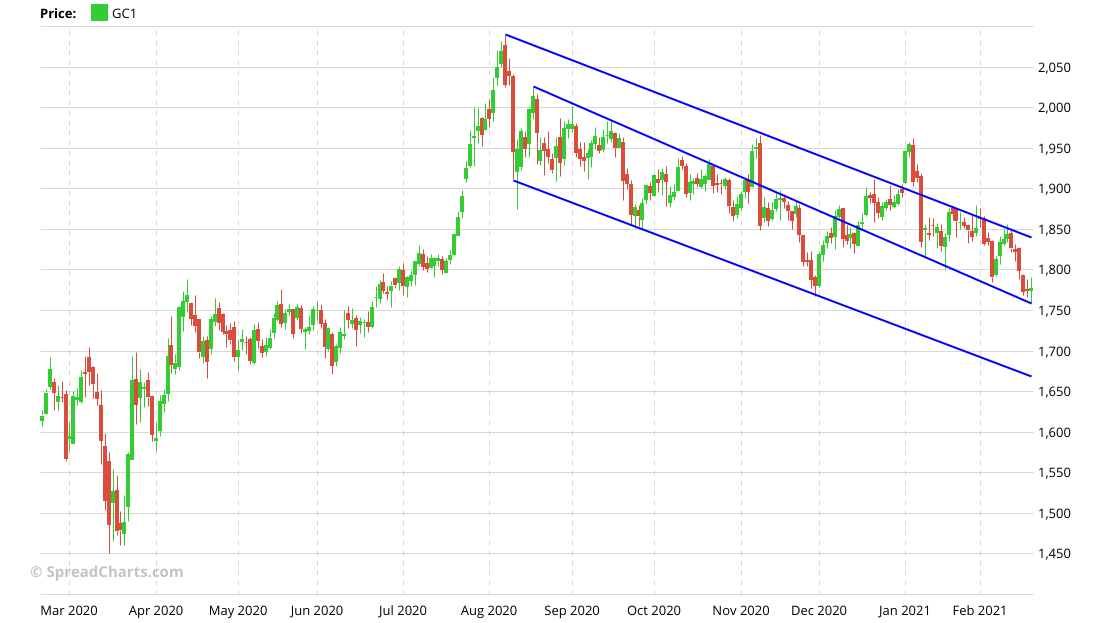
“For the bullish scenario to play out and gold to reach $2000 before $1680, we want to see a bullish price action soon, preferably over the next few days. No consolidation! The market may consolidate, but not here below $1850. That would be bearish.”
If you look at the chart today, you’d see the price was consolidating for the rest of January. Unsurprisingly, it broke the $1800 support in February and is now trading in $1770s. Does it mean our target at $1680 remains in place? The short answer is yes. But the situation is never straightforward, and the longer answer might provide more clarity.
First of all, we won’t be fixing at a specific target price as it does not work. It’s much wiser to make decisions based on the current market situation. And that can change quickly.
Let’s start with the fundamentals. Gold’s behavior might look somewhat counterintuitive. Most of the time, the price of gold is inversely tracking the real longer-term rates. That’s, however, not the case lately.
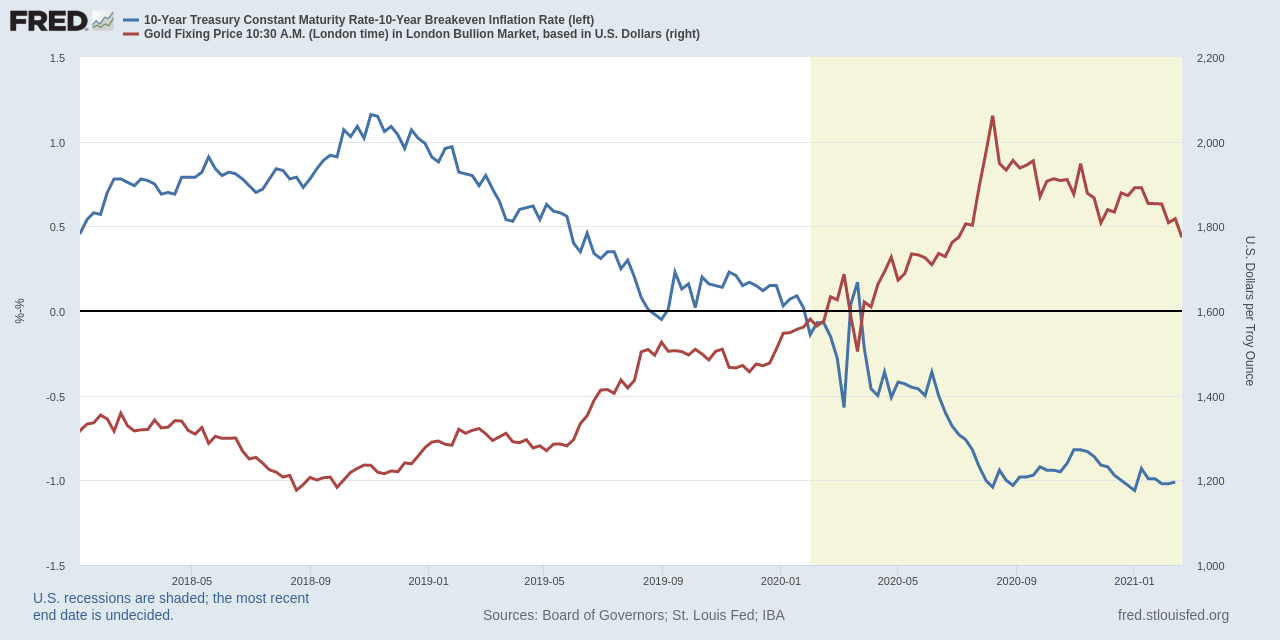
Real rates have bottomed at the beginning of August 2020 and are moving sideways since then. The point is that they are not rising. But gold is going down nonetheless. The price seems to be (inversely) reacting to nominal rather than real yields. And that’s the reason for our continued bearishness, as the nominal longer-dated yields will most likely continue to surge in the very short term.
The sentiment is another reason for cautiousness. While the amount of both speculative and hedging positions has decreased significantly, the market is not yet oversold. We’ve not yet seen the real pessimism that marked intermediate bottoms in the past.

Speaking about sentiment, US Dollar is heavily oversold, and we expect a countertrend rally in the medium term. It’s hard to imagine that gold would react positively to such development. Gold may turn higher before the dollar rally fizzles, but at least the initial reaction would be definitely negative.

We may still get a very short-term bounce on gold, but playing such a bounce might be very dangerous. The risk/reward is not very good.
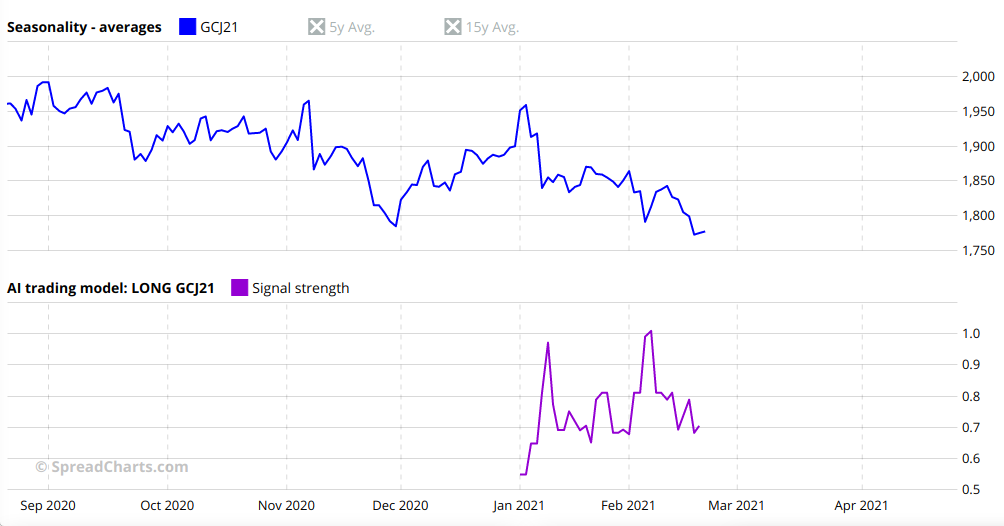
Another strange thing is that our AI model on SpreadCharts flashed a valid buy signal after the selloffs in both January and February that led to tradeable rallies. This time, however, there is no such signal.
Before you turn entirely pessimistic, keep in mind it’s critical to distinguish between different time horizons. We remain long-term bullish on gold due to the fundamental factors explained in the premium video analysis on SpreadCharts from Jun 8th, 2020. Even a 25% correction would be totally normal, given the powerful rally last year. That would imply a bottom around $1550. But this is just a random number. The point is, even though the downside can be larger than you think right now, it always helps to zoom out the chart and focus on the big picture.
Check out these great articles as well
New data: Sector indices
Our software is already established well beyond commodity market analysis. Stock indices, currencies, and even...
Read moreWhat’s new in the SpreadCharts app?
It’s been a few months since we launched the new version of the SpreadCharts app....
Read moreA major new version of the app is here
Today, we’re excited to show you the major new version of the SpreadCharts app that’s...
Read moreLiberation Day!
Tariffs are arguably the dumbest part of Trump’s agenda. Yes, the goal makes perfect sense,...
Read more