Why Excel won’t be enough?
In the previous article, I’ve explained what quantitative trading is about. In this article, I will briefly describe how to start your own research. As I wrote last time, I’m writing about my path and my approach, which may not suit everyone. So take this article as an inspiration.
Quantitative trading has a great advantage that you don’t have to buy expensive software. All the necessary tools are available for free as open source software. This is offset by the fact that instead of money, you have to invest a considerable amount of your time. It can be an advantage for students who typically have more time and less money.
You’ll need to learn a scripting language (Python or Bash), a compiled programming language for the calculations (C/C++) and a tool for mass plotting (matplotlib or gnuplot). It will also be very advantageous to switch to Linux, which is much more suitable for calculations and working with data than Windows. If you were expecting me to reveal some marvelous shortcut, I have to disappoint you. No such thing as “quantitative trading quickly and easily” exists. That doesn’t mean you won’t see partial results sooner. Even if you don’t know how to code, after a few weeks of intensive study you can have the first results of your experiments with real market data. Quantitative trading is a never ending journey. But this is what I have found personally appealing. It’s not something you just learn and you’re done. You have to constantly work on developing your skills and knowledge. I’m constantly tracking scientific developments in the field of machine learning and deep learning methods, which I then take into account in the development of my own algorithms.
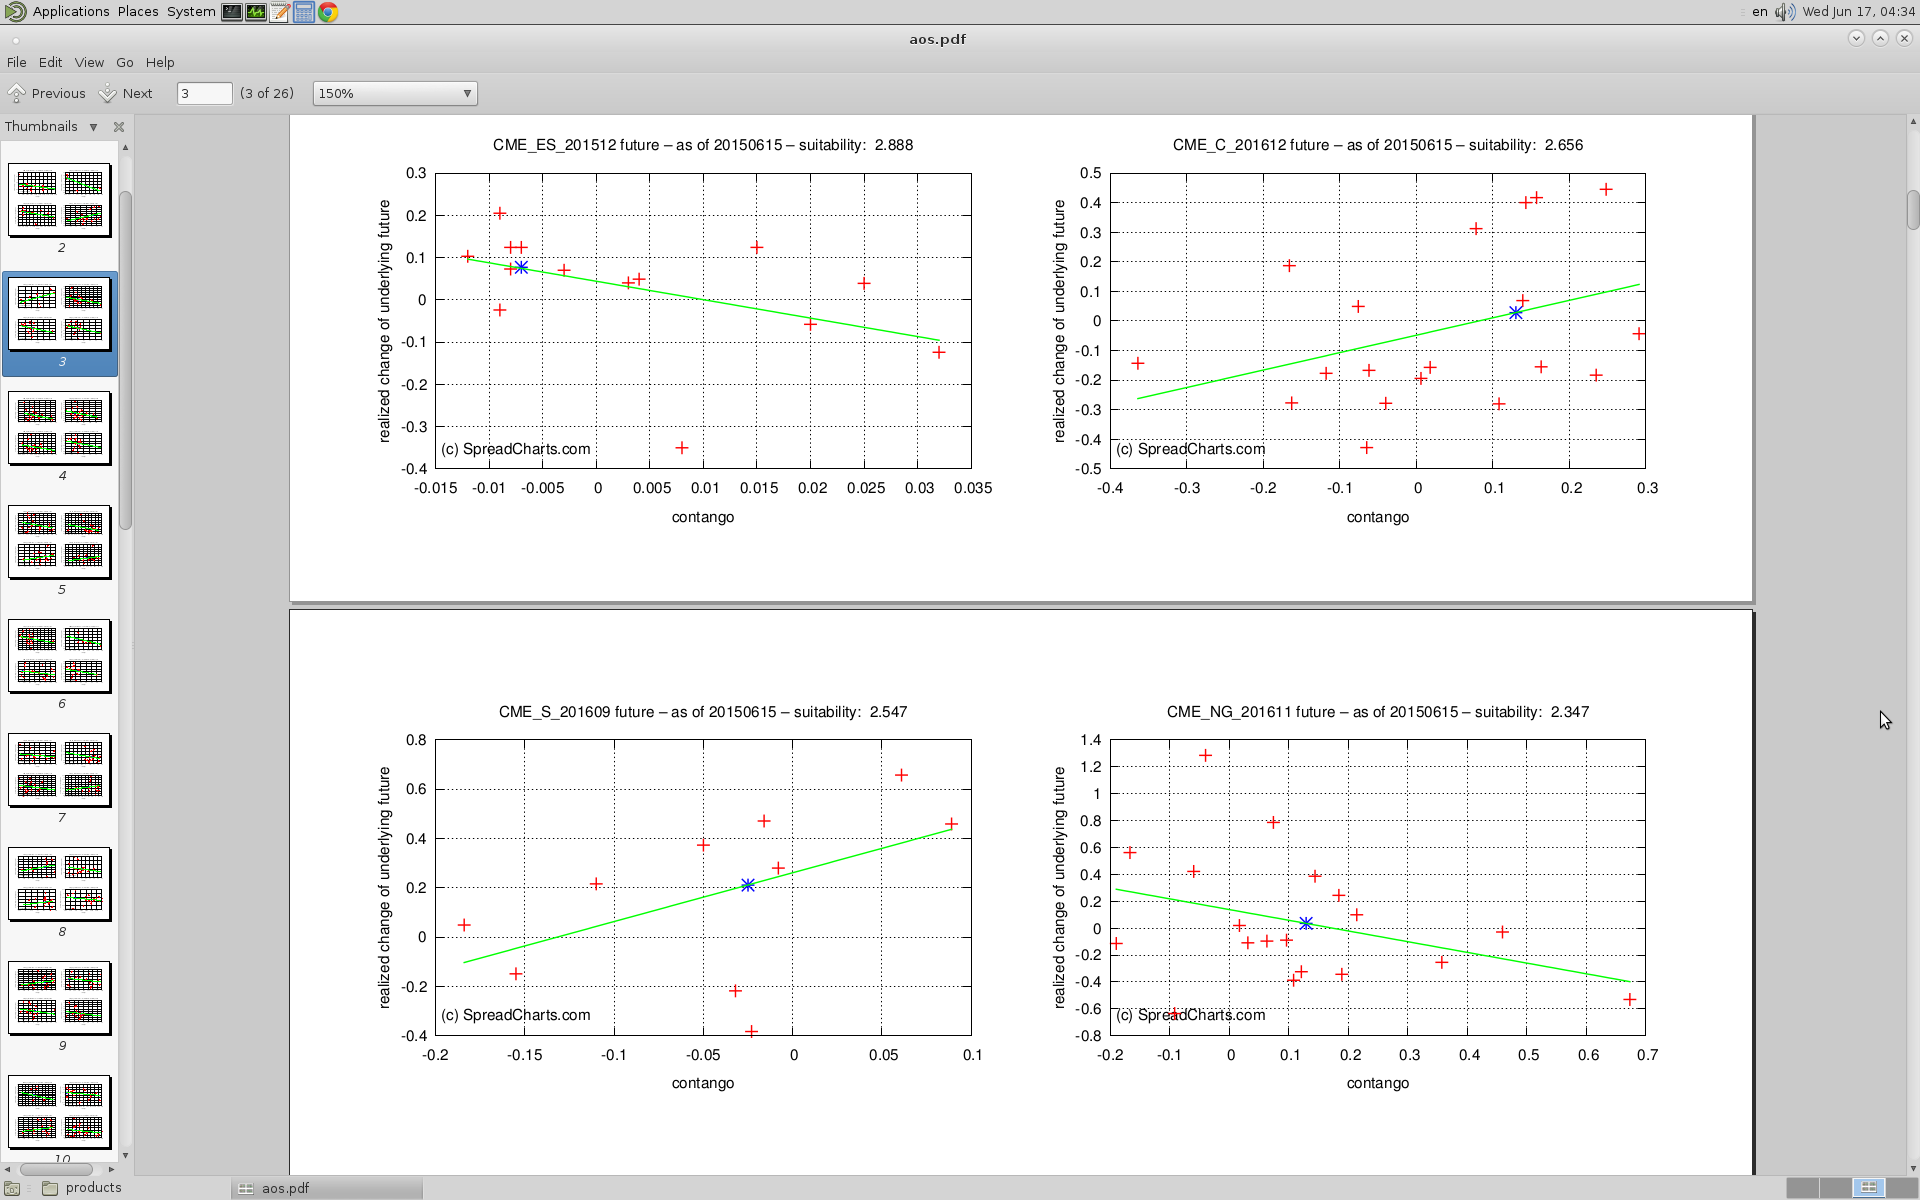
Some people with whom I’ve talked regarding this argued that learning to code is useless today – calculations and data processing can be comfortably done in Excel. Excel or Openoffice is great for quick data analysis, but your options with Excel are very limited. I always give one of my own tools as an example. The tool searches for trading opportunities in futures markets, depending on seasonality and relative contango. It works in such a way that I just execute the main Bash script, which calls a subscript that connects to a remote server and automatically downloads the current market data for all futures. Another script then sorts the data and corrects any errors. The main script then calls a C program that performs a simulation of outcomes of all the historic trades depending on seasonality and contango for all futures going back a few decades. The program also contains my own numerical method, which creates a simple probabilistic model for each future contract and verifies its compliance with reality. Comparing all these models together, my program then recommends specific futures contracts, where there is a high probability of a significant move up or down till expiration. These results are used to automatically generate tens to hundreds of charts using the gnuplot plotting pipeline. The main script eventually creates a source file for typesetting and typographical system LaTeX, which groups the charts by commodity and generates a few tens of PDF files that I can finally view.
Do not try to understand everything in the previous paragraph. I’ve described it so that you can have an idea of how these complex operations must be undertaken. At the beginning is a huge amount of confusing data and at the end is a folder with sleek pdf documents. I don’t want to speculate how long it would take you to handle something like this in Excel, but I guess that would be a couple of weeks. Do you know how long it takes my script? A few minutes! The difference is enormous. That is also the answer to the question in the title. The ability to write your own scripts and programs isn’t about saving time, it’s about being capable of doing things that wouldn’t even be possible in Excel. It opens you up to completely new possibilities.
The analytical tool for seasonality and contango described above is already quite advanced. I created it last year. I started with much simpler things many years ago. The same path awaits those of you who embark on a way of quantitative trading. So don’t feel discouraged if you’ve found some of my descriptions complicated. I’ve attached a screenshot of one of the pdfs generated by my tool as described in this article (just for illustration).
Check out these great articles as well
New data: Rates and electricity
As promised, we’re adding new data to the SpreadCharts app. Importantly, the goal is not...
Read moreNew data: Sector indices
Our software is already established well beyond commodity market analysis. Stock indices, currencies, and even...
Read moreWhat’s new in the SpreadCharts app?
It’s been a few months since we launched the new version of the SpreadCharts app....
Read moreA major new version of the app is here
Today, we’re excited to show you the major new version of the SpreadCharts app that’s...
Read more