Commodity spreads 15: Why the seasonality is not enough?
In the last part of the commodity spread trading series, we started with seasonality. Every spread trader should know why it exists, but also know its advantages and disadvantages. At the end of the previous lesson I wrote the sentence: “But the seasonality itself is not enough for me!” Today I will explain why this is the case and how my trading system puts more weight on other analyses.
When seasonality fails
We already know the main thing behind seasonality are the weather cycles. Yes, the longer-term weather changes throughout the year are very similar each year. But can we rely on it with our money? I think we can not. As you know, the weather is mostly unpredictable in the short term. We can experience normal weather for 10 years only for the 11th year to be totally different. This may be due to oceanographic phenomena known as El Niño or La Niña for example. They have the power to cause major changes in temperatures and also affect rainfall in important agricultural areas in key parts of the year. These phenomena can have adverse impact on crops and turn the seasonal normals upside down.
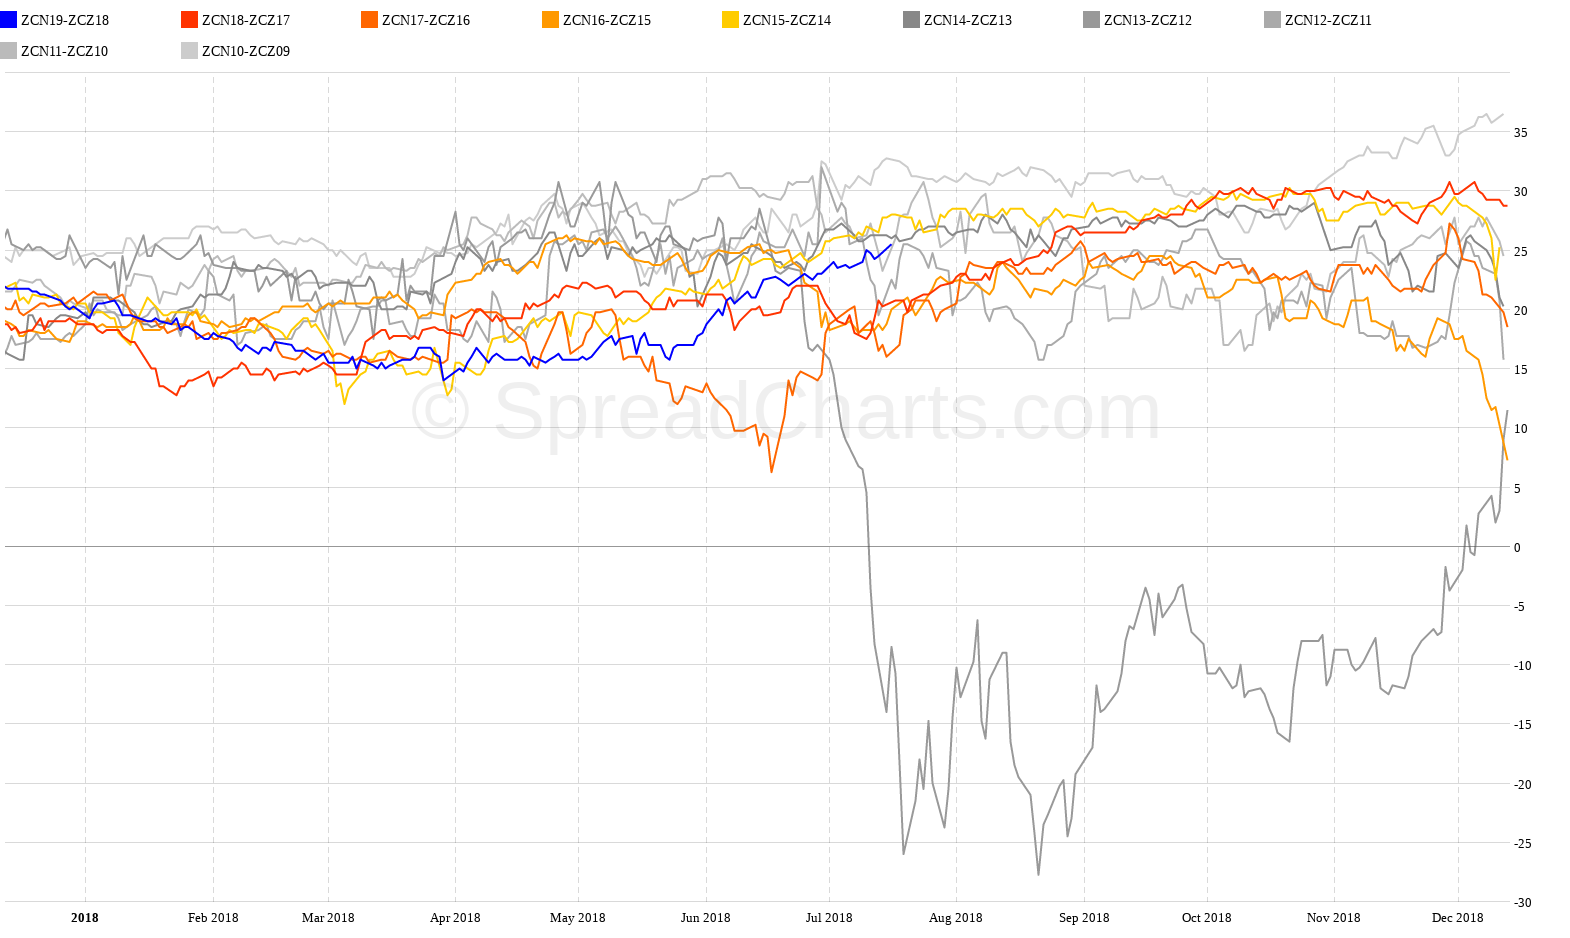
One typical example was the drought in 2012, which caused a sharp rise in grain prices. Do you think seasonality played a role there? Unfortunately, no. The following chart with detailed seasonality of the well-known and popular bear spread on corn July – December is the proof. Notice the grey curve that looks like it doesn’t belong to the chart. That’s the 2012 year when the spread has fallen off the cliff, contrary to otherwise reliable seasonal trend during that part of the year. If a trader relied only on seasonality while having bad risk management, he suffered a lot.
Nothing works forever
Many of my students and my colleagues used to trade just with seasonality analysis. It was working perfectly for a few years. All they had to do was just to follow some seasonal signals. They had become overconfident and convinced that trading is easy, and it will be forever so. Then came an abnormal year when seasonality suddenly ceased to work, and their losses were often huge . They were stubbornly sticking with their open positions, trusting seasonality and expecting a turnover. They were saying, “Seasonality must eventually prevail.”
These traders often did not even know what they were doing. They did not know what drives inter-delivery spreads or what it means to hold bear or bull spread (especially with regard to risk). They didn’t understand contango or backwardation effect, etc. However, if you have gone through this commodity series from the beginning, you have a big advantage. Spreads are pretty much understandable, and they give you a more in-depth look into the markets. That’s why beautiful seasonal curves won’t seduce you anymore.
Seasonality as a rear-view mirror
I often compare seasonality to the rear-view mirrors in a car. No doubt they are very important when driving. We can see what is behind us, whether some car is overtaking us, etc. Without the mirrors, we cannot drive safely. But can you imagine driving only by the rear-view mirrors, for example with a darkened windshield? I don’t think so! You need to know what’s ahead of you, what obstacles to avoid, whether you can speed up or rather slow down. It works the same in trading. We need to see the current state of the market! Keep following indicators that tell us what’s ahead of us. Trading based just on the fact that something worked in the past is not enough!
Seasonality is like a look into the past. It can tell us how a given futures contract or spread tends to behave in a certain period. But it won’t tell us what’s happening right now. Entering or exiting the positions using just seasonality does not lead to stable results in the long term.
What if a market changes?
In addition to weather, there may also be some fundamental long-term change on the market, whether on the supply or demand side. Here are just a few examples:
- new mining technology / producing method of a particular commodity -> higher supply (e.g. fracking in crude oil and natural gas)
- the emergence of a new industry that increases the demand for a particular commodity (biofuels industry increases demand for corn)
- a new more resistant breed, a method of processing, etc. (genetically modified plants, resistant to diseases)
Seasonality gives us zero information about the changes that are happening on the market. For this reason, we have to work with other analyzes. These include, for example, COT analysis, market structure analysis, analysis of carrying charges, and others. We also need to understand how spreads work. Why to choose a specific strategy, what are the advantages and disadvantages, what to watch out for, etc. You already know many of these things, and I will write about many others.
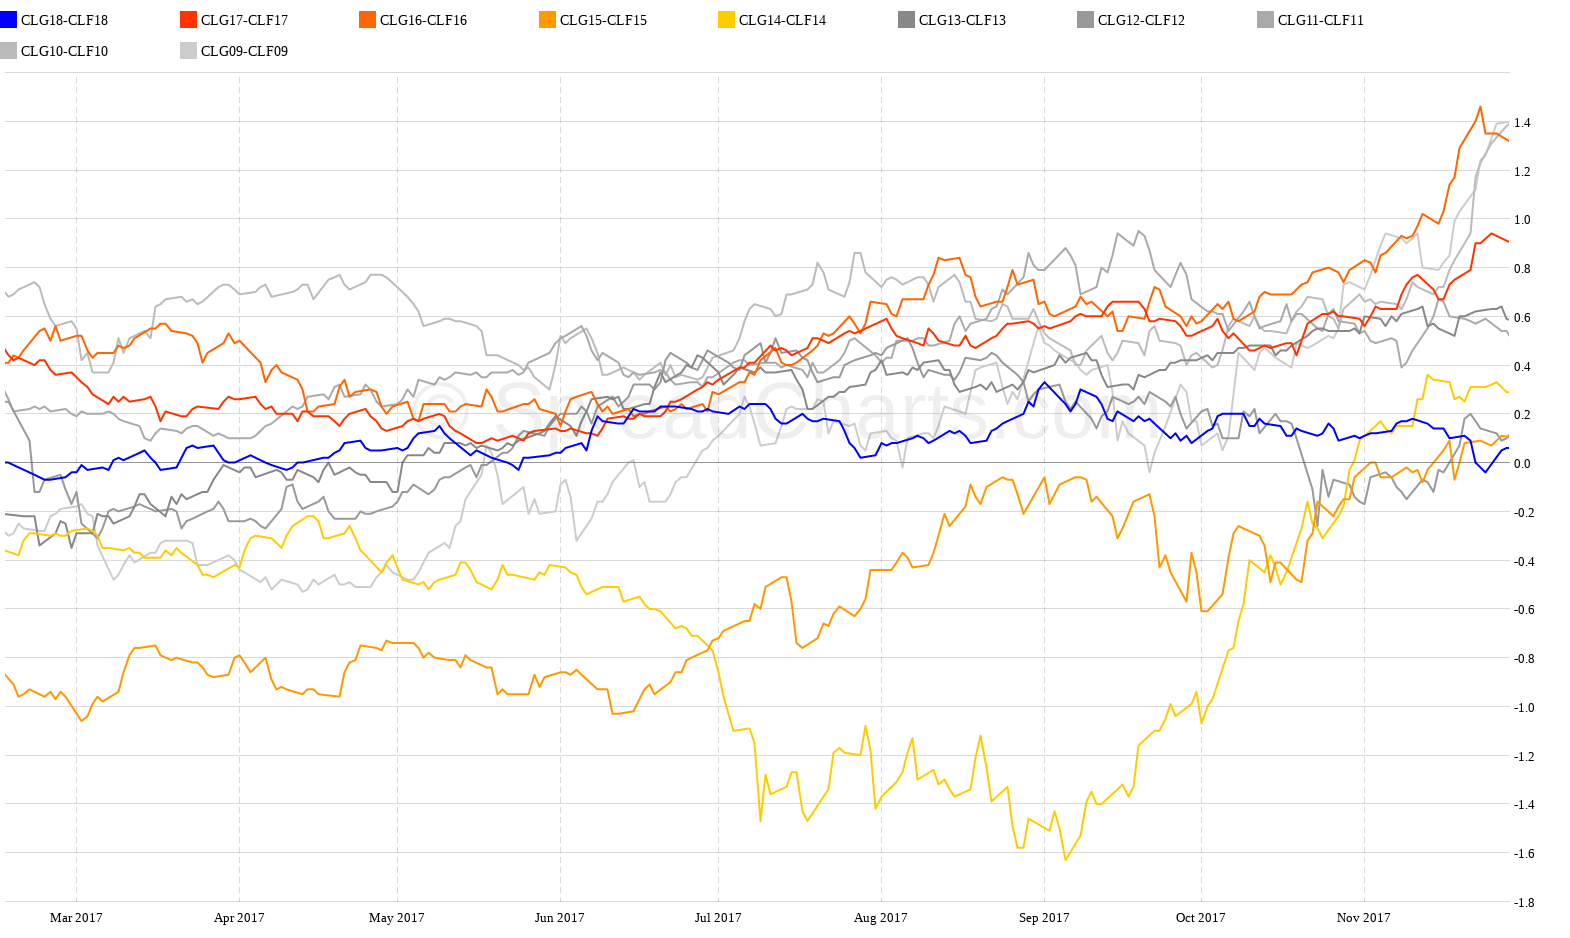
At the end of this article, just for curiosity, I attach seasonal analysis of one bear spread in crude oil, particularly between February and January. You may notice a perfect rising trend. Despite that, one year is clearly out of sync…
Check out these great articles as well
New data: Sector indices
Our software is already established well beyond commodity market analysis. Stock indices, currencies, and even...
Read moreWhat’s new in the SpreadCharts app?
It’s been a few months since we launched the new version of the SpreadCharts app....
Read moreA major new version of the app is here
Today, we’re excited to show you the major new version of the SpreadCharts app that’s...
Read moreLiberation Day!
Tariffs are arguably the dumbest part of Trump’s agenda. Yes, the goal makes perfect sense,...
Read more
