Commodity spreads 14: What is seasonality?
After thirteen parts of the spread series, we have the perfect base for trading commodity spreads. Now we can go to the specific analyzes I use to select the right trade. In the last part, I have offered a glimpse into seasonality and today I will focus just on this topic. There is no doubt that seasonality is an indispensable part of spread trading. What may surprise you is that I, however, consider it just a secondary factor in selecting my trades. Let’s explain why.
Seasonality and weather
Seasonality is a widespread phenomenon we encounter in our everyday lives. A typical example is the temperature change during the year that affects all of us. Let’s demonstrate this for example on home heating. Our heating costs are logically the highest in winter as it is the coldest part of the year. We expect temperatures to gradually rise during springtime. Our heating costs will therefore decrease. In the summer the temperatures are the highest, and we do not have to heat our homes at all. In the autumn, however, a colder period begins again, and expenses start to increase again. This cycle repeats every year. These temperature trends are not working with daily precision. Sometimes the winter can be very mild, or there can be freezing temperatures in spring. Nevertheless, it holds true in the long term.
Seasonality and tomatoes
My favorite example is tomatoes, more precisely their prices. You have certainly noticed that tomatoes are the most expensive in the winter. It’s obvious because they don’t grow in winter on the northern hemisphere (with exception of greenhouses). The vast majority of tomatoes is imported, which is also reflected in their price. On the contrary, in the spring, when the local producers begin to supply more vegetables to supermarkets, prices tend to fall gradually. The price is the lowest during summer as there is plenty of tomatoes everywhere. This repeats every year. Of course, I talk only about change and price direction, not the exact price levels.
Seasonality and commodities
The same effect is observable in most commodities you can trade on the exchange. The more commodity is supplied to the market, the lower is the price. Conversely, when there is a less commodity on the market (or demand exceeds supply), the price goes up. This is the essence of price trends and at the same time a basis for understanding seasonality. To be precise, seasonality is the result of uneven distribution of supply and demand over time.
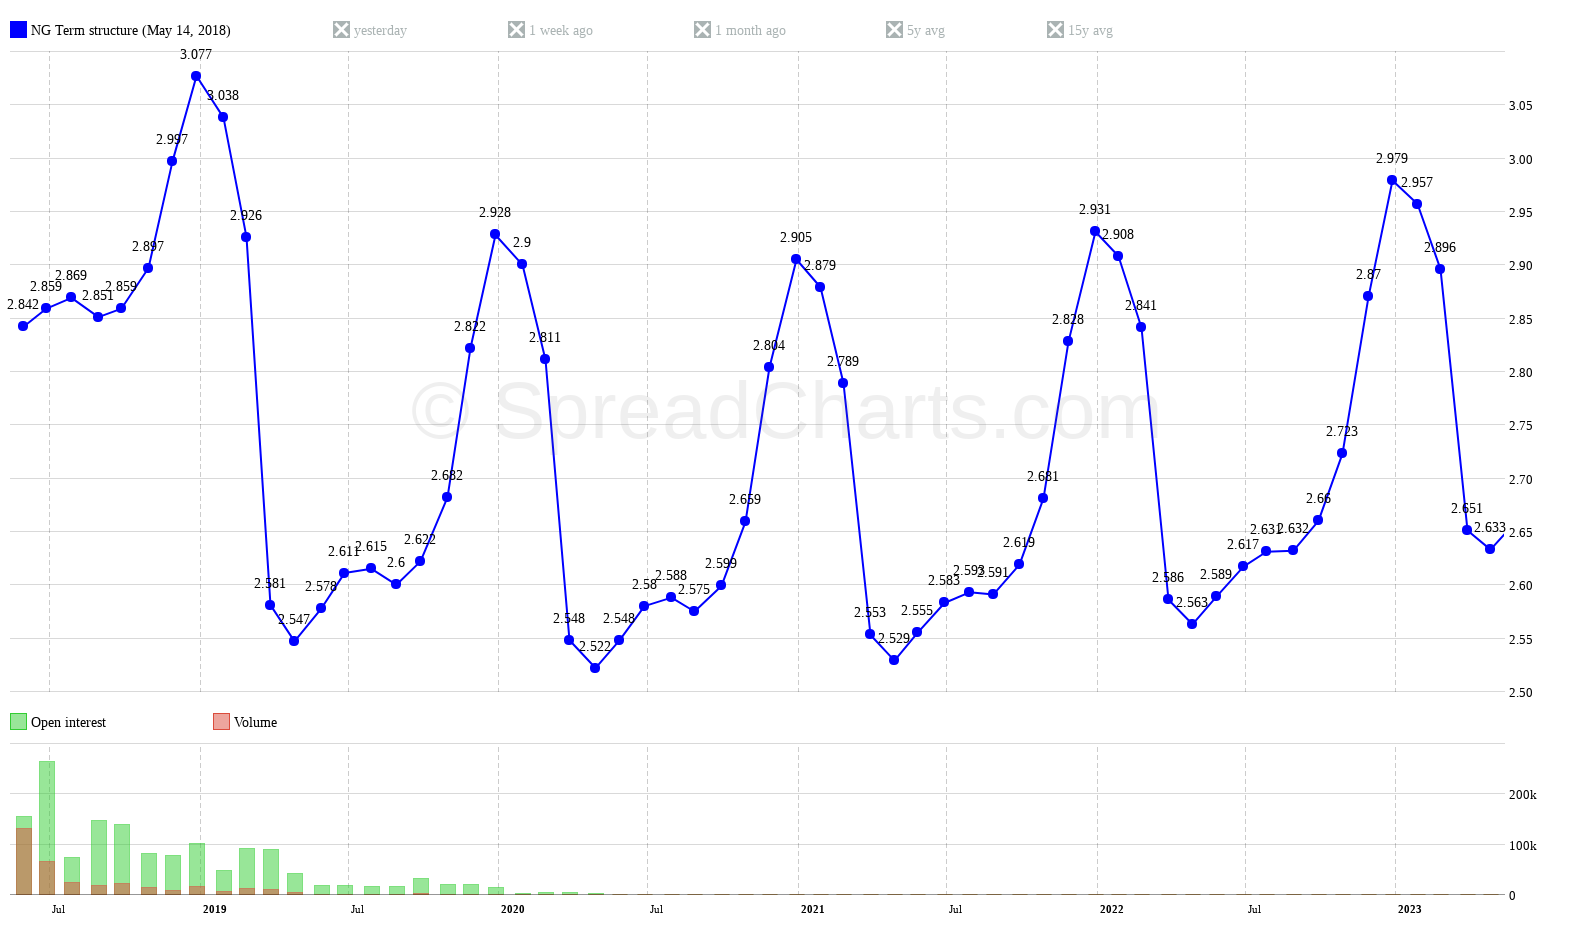
A typical example of supply fluctuations during the year can be seen in grains. In the previous article I wrote about corn. The cyclic waves were clearly visible in the term structure chart, which is caused by a new crop hitting the market after harvest each year. On the demand side, a typical example is natural gas or heating oil. The natural gas term structure can be seen in the following chart. Repeating waves are evident at first glance. Note that the market expects the highest prices in the winter months due to increased heating demand.
For natural gas, we notice cyclical patterns in demand, while for corn it’s in supply. Both are influenced by one thing – climate. Various influences can cause seasonal patterns. But the weather is the most important one. That’s why seasonality works so well. Because it is based on natural cycles. However, you need to be very careful about the right way how to understand it. Seasonality works well over a long period of time. Moreover, the seasonal effect is not precise. It doesn’t kick in on the exact calculated day. Sometimes it may not even show up at all. It is not guaranteed that tomatoes will be the cheapest tomorrow or that the first snow will come on December 1st.
When you start analyzing seasonality, it is very important to realize this fact. Many traders, however, use seasonality solely and have the whole trading system based on it. Many different procedures and methods have been developed to optimize the entry or exit from the trades. But the seasonality itself is not enough for me!
What can you expect next time?
Next time, we will continue to explore the seasonality. It is simple to use, but there are a few other things I would like to tell you. For example, what charts should you watch and how to work with them.
Check out these great articles as well
New data: Sector indices
Our software is already established well beyond commodity market analysis. Stock indices, currencies, and even...
Read moreWhat’s new in the SpreadCharts app?
It’s been a few months since we launched the new version of the SpreadCharts app....
Read moreA major new version of the app is here
Today, we’re excited to show you the major new version of the SpreadCharts app that’s...
Read moreLiberation Day!
Tariffs are arguably the dumbest part of Trump’s agenda. Yes, the goal makes perfect sense,...
Read more