Commodity spreads 13: How to assemble an interdelivery spread correctly?
In today’s article, I would like to sum up everything we have discussed so far. We will delve into the very popular corn market and take a look at the spreads we can trade here. We will find out which combinations of spreads will be the best in our case.
Contango histogram
When you analyze some market, it is a good idea to start by looking at the market from a certain distance. This is where contango histogram comes very useful. It can quickly show us what type of market we’re dealing with. The first chart shows the contango distribution between the first and second expiration month and the second chart between the second and third month.
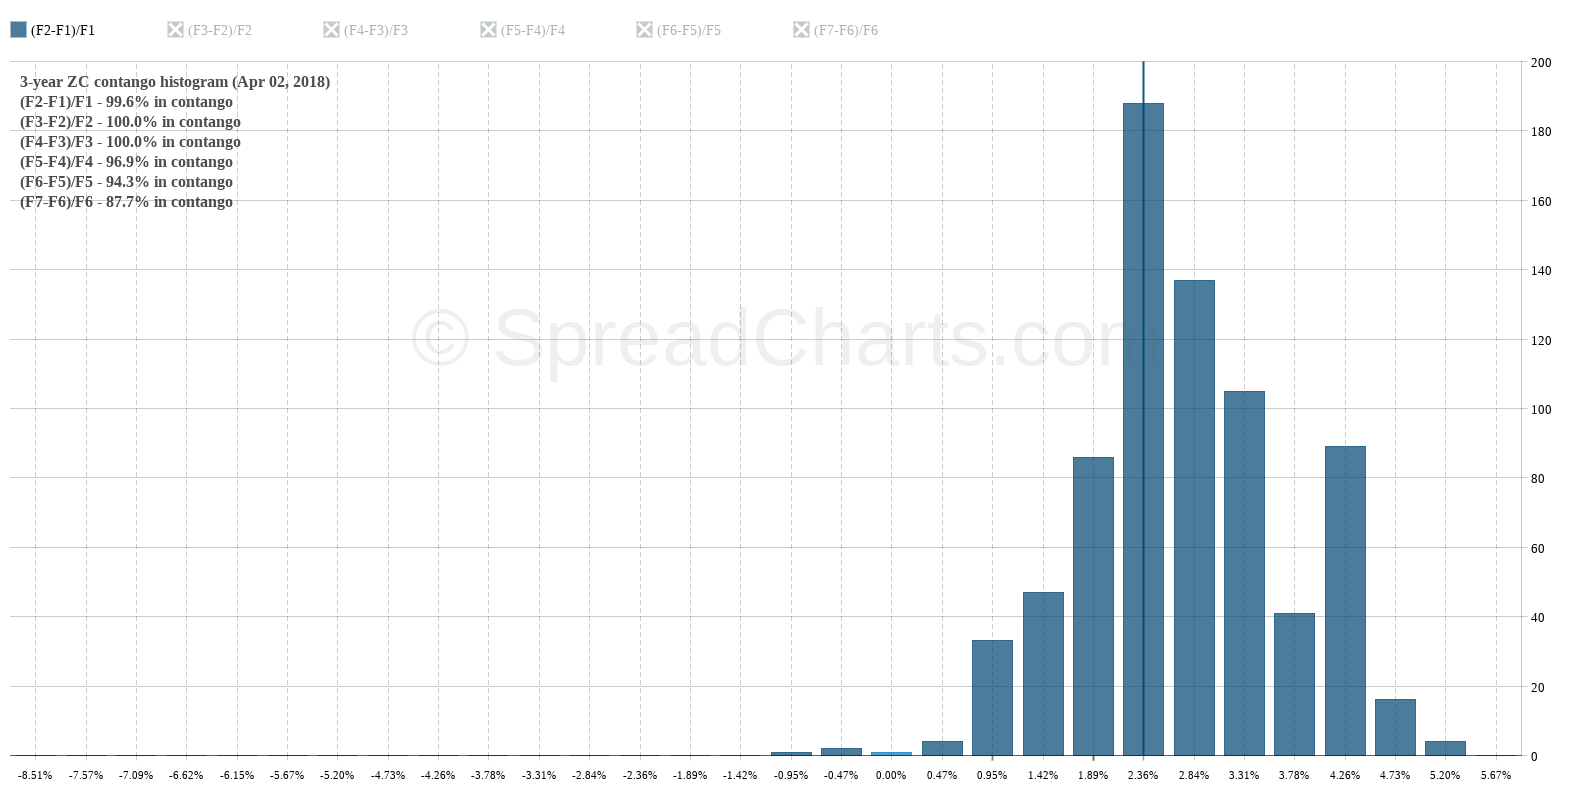
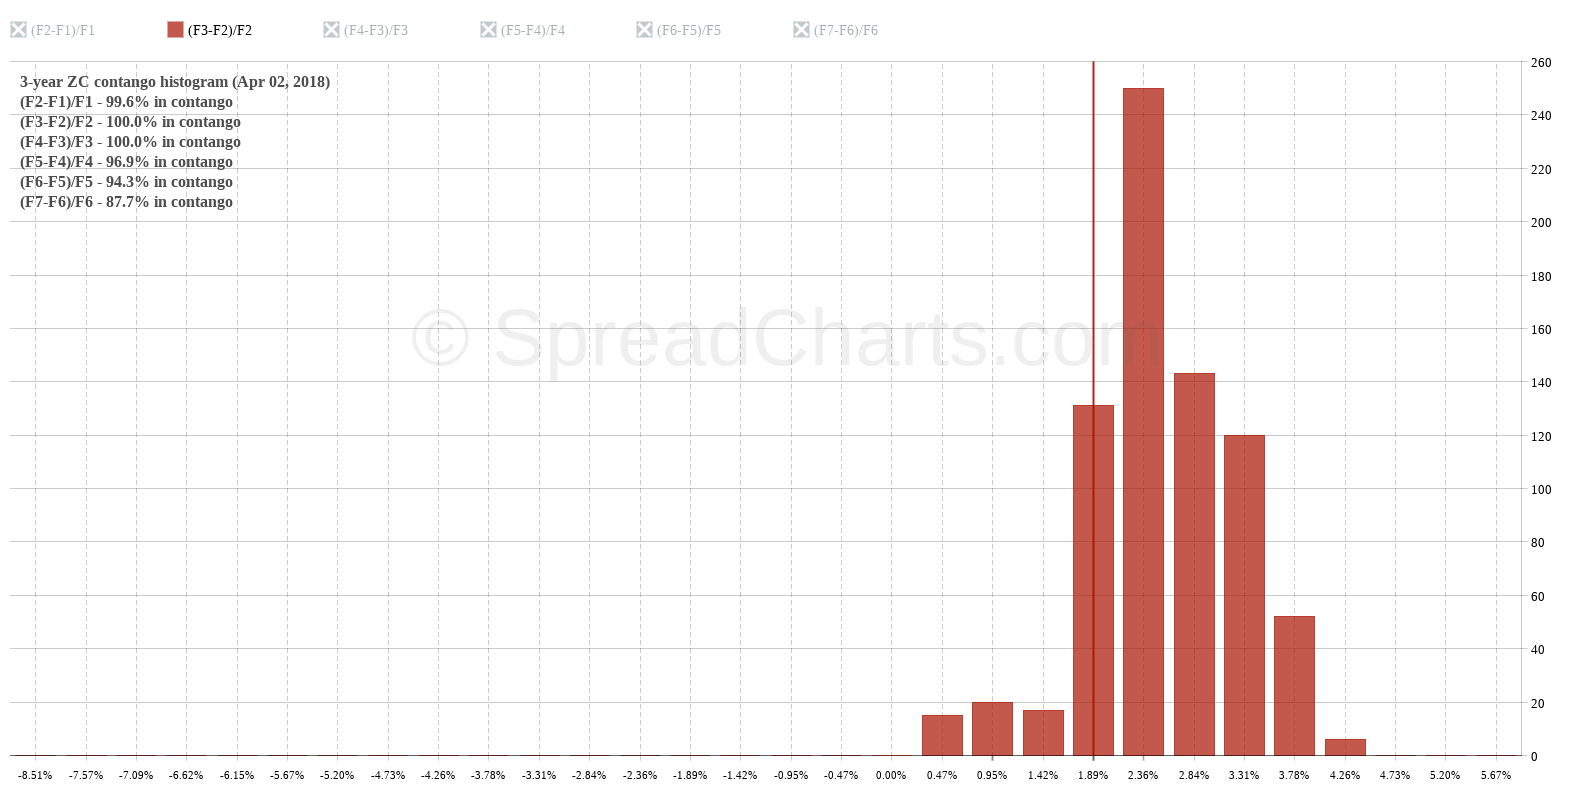
I think it is immediately clear that the market has been in contango over the last 3 years. We can get this information straight from the table in the top left corner. In such a market, the bear spreads are usually the right strategy (the reason was described in the previous article).
What spread combination to select?
You already know that there are many ways how to combine different expirations in interdelivery spread trading. However, when considering the success rate and the overall risk, the right expiration selection do matter. Here’s where the term structure charts is of great importance to us.
The term structure can tell us valuable information about the market, which we would otherwise only get through a detailed study of supply and demand. It’s because supply and demand trends are ultimately reflected in the shape of the curve. Thanks to this, we can observe a variety of ripples, switches to backwardation, etc., which tend to repeat over the years.
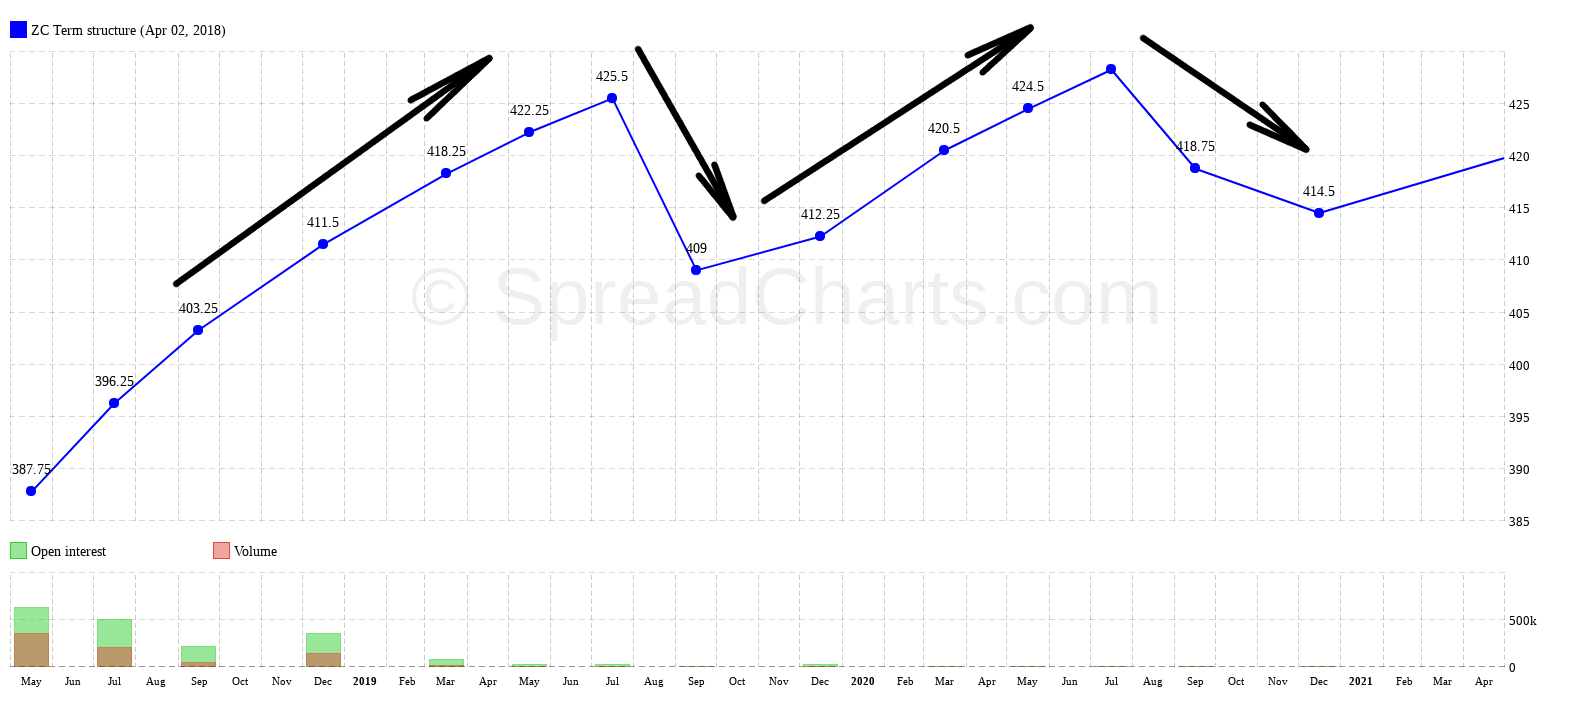
At first glance, there are two peaks where the curve is noticeably cut off. Specifically, it is July. September contracts are already at a lower price. The reason is simple. Corn harvest begins in September. The market, therefore, expects increased bid, which logically pulls the prices down. Term structure clearly highlights which contracts belong to the same crop. They are December up to July of the following year.
Why not September? This contract is generally not very popular due to the risk of mixing two crops. It is not certain whether the September contract will fall into the old crop. However, in December it is certain that it already belongs to the new crop. Moreover, we also know that July still belongs to the old crop because there is still no chance that harvest begins at this time. I’m talking about the US corn, of course.
When I summarize this, we will mainly trade bear spreads in corn. As we have already explained, bear spreads profit from contango, which we can observe mostly within a single crop. That’s another logical point. The price is usually the lowest after the harvest when a lot of new corn lands on the market. Gradually, as time goes by, corn supplies are shrinking, and therefore the market expects higher prices. Of course, let’s not forget the storage costs, which also play a role here.
We trade bear spreads in such a situation when we do not expect any big surprises in the market that would cause a spike in commodity price. We want a normal market (i.e. contango), falling commodity price, or movement roughly sideways.
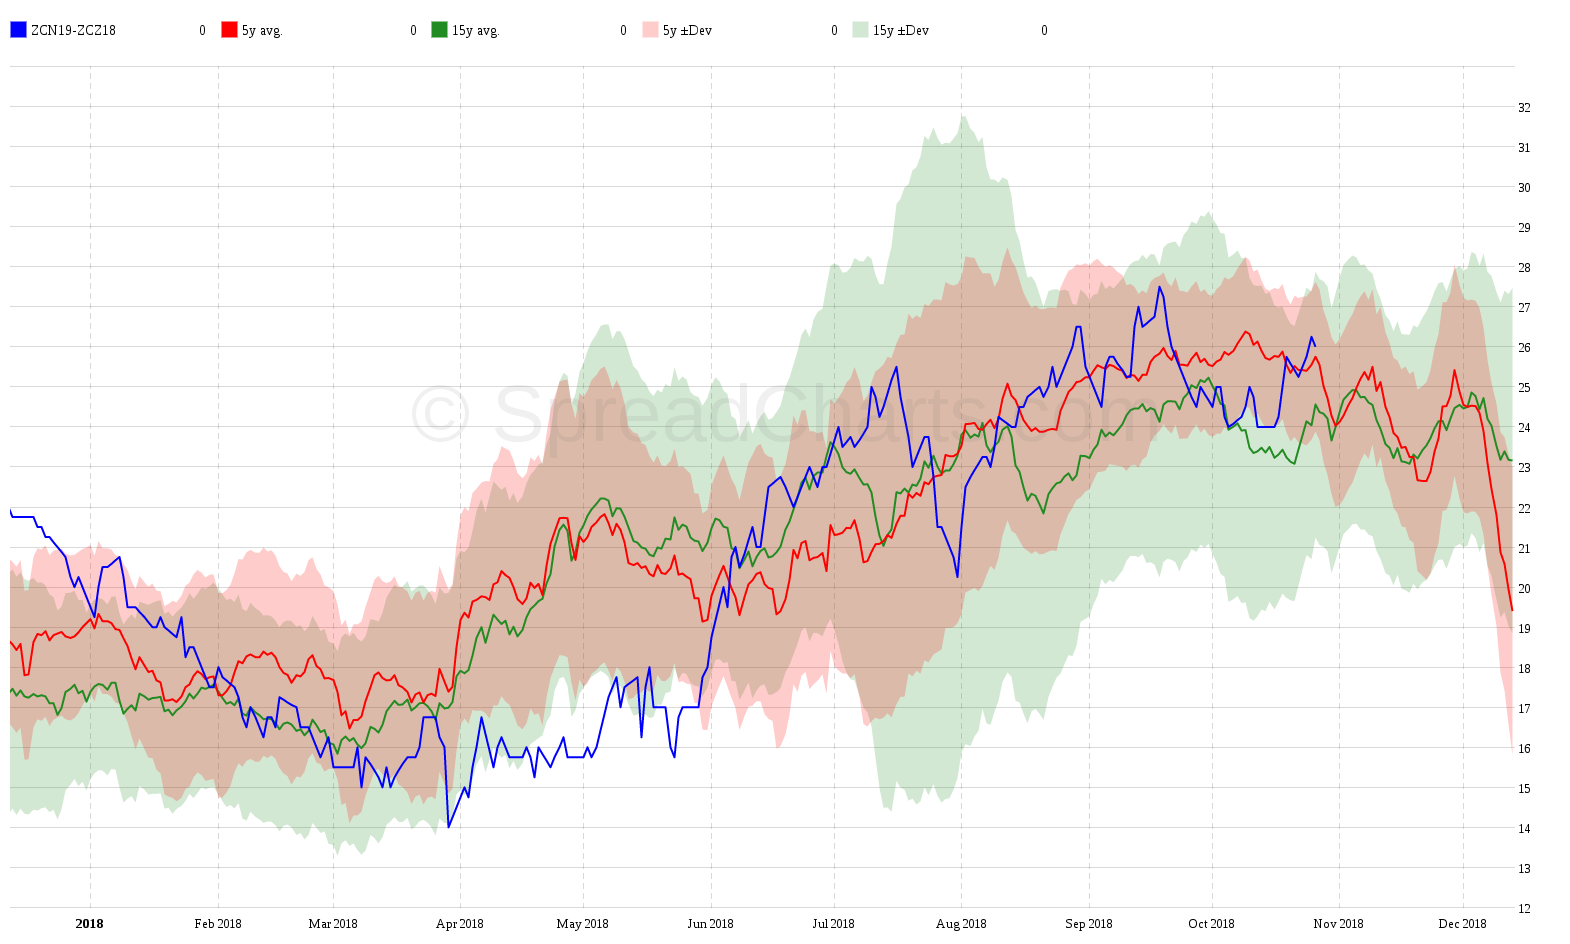
The most popular and most liquid bear spread in corn is July next year – December (currently ZCN19-ZCZ18). That’s the widest possible spread within a single crop. From the price/carry ratio analysis, there is a clear rising tendency of spread at first glance.
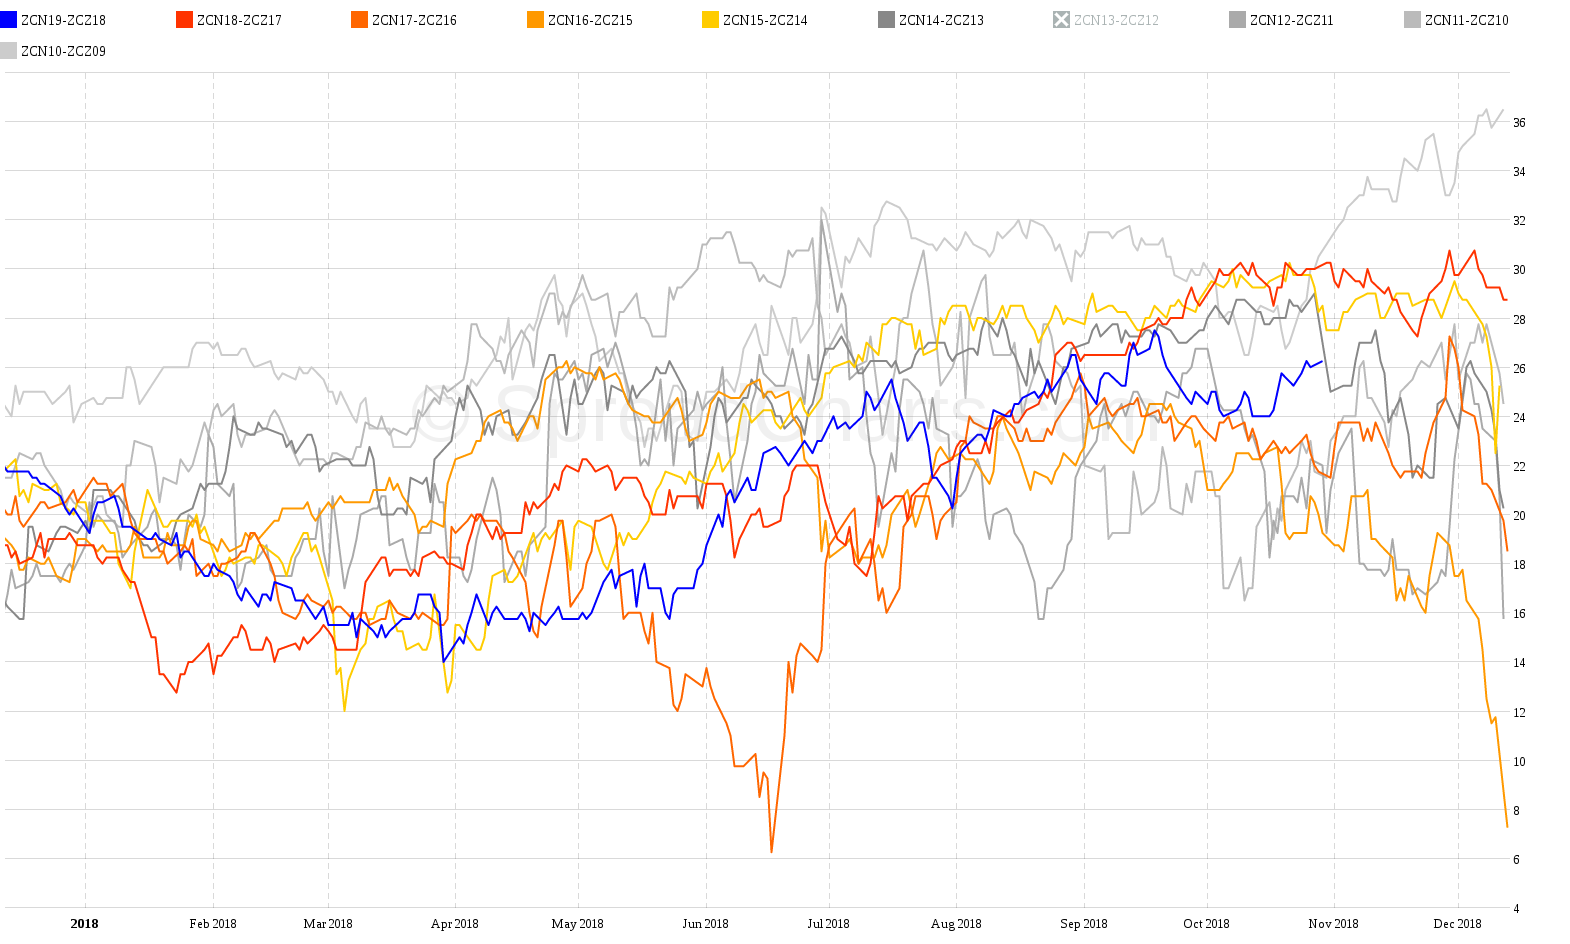
This increasing tendency can also be seen on the seasonal averages.
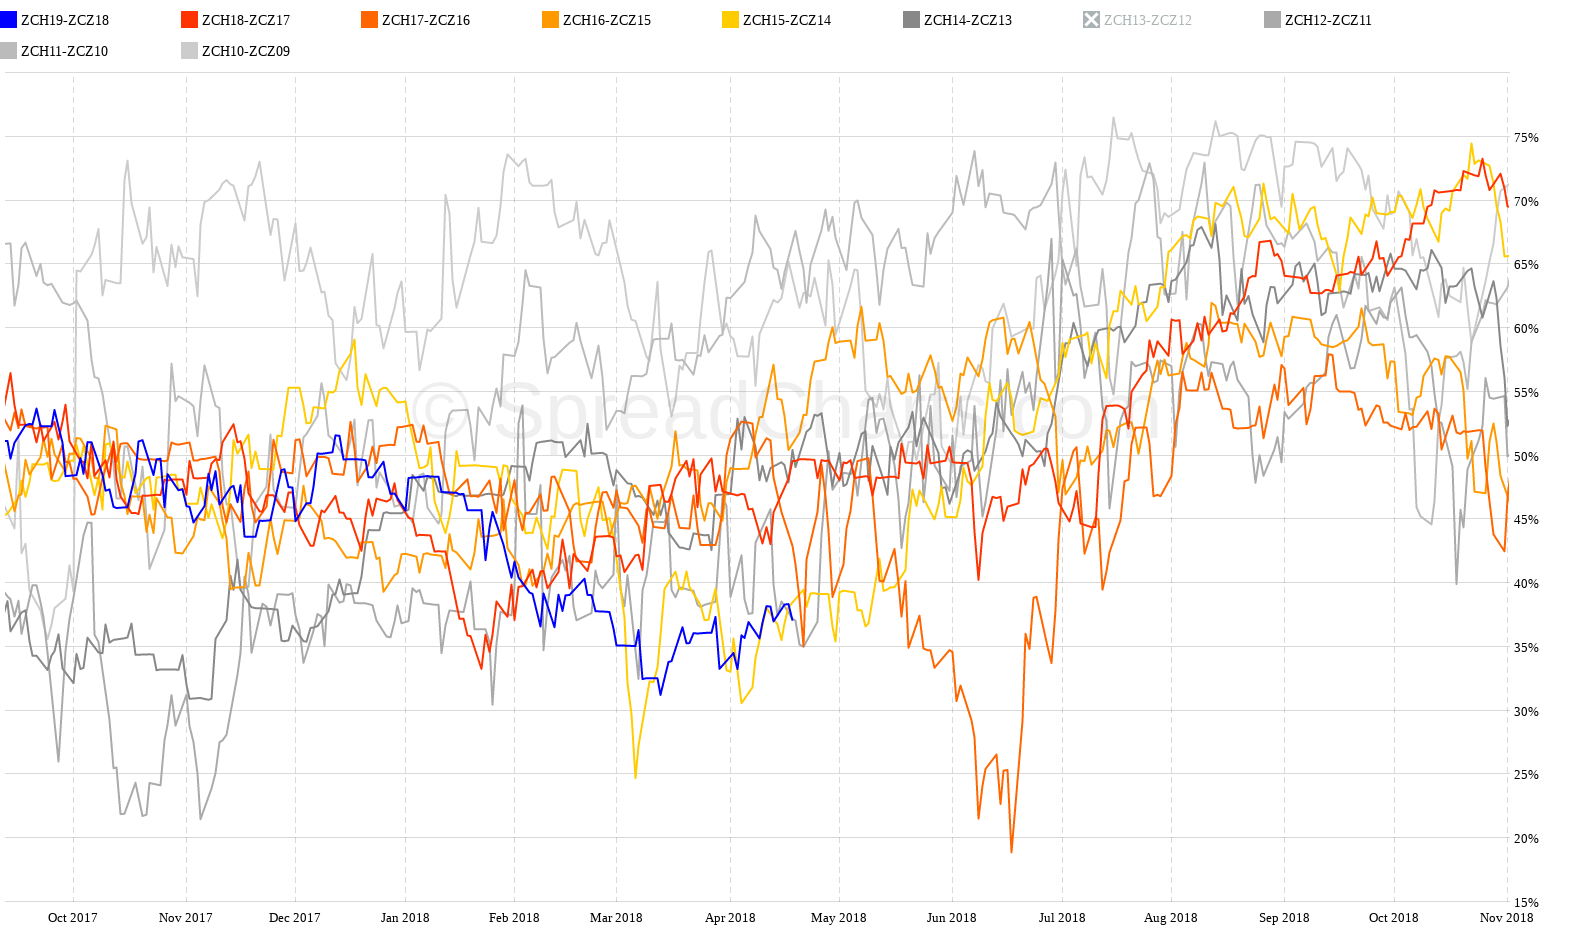
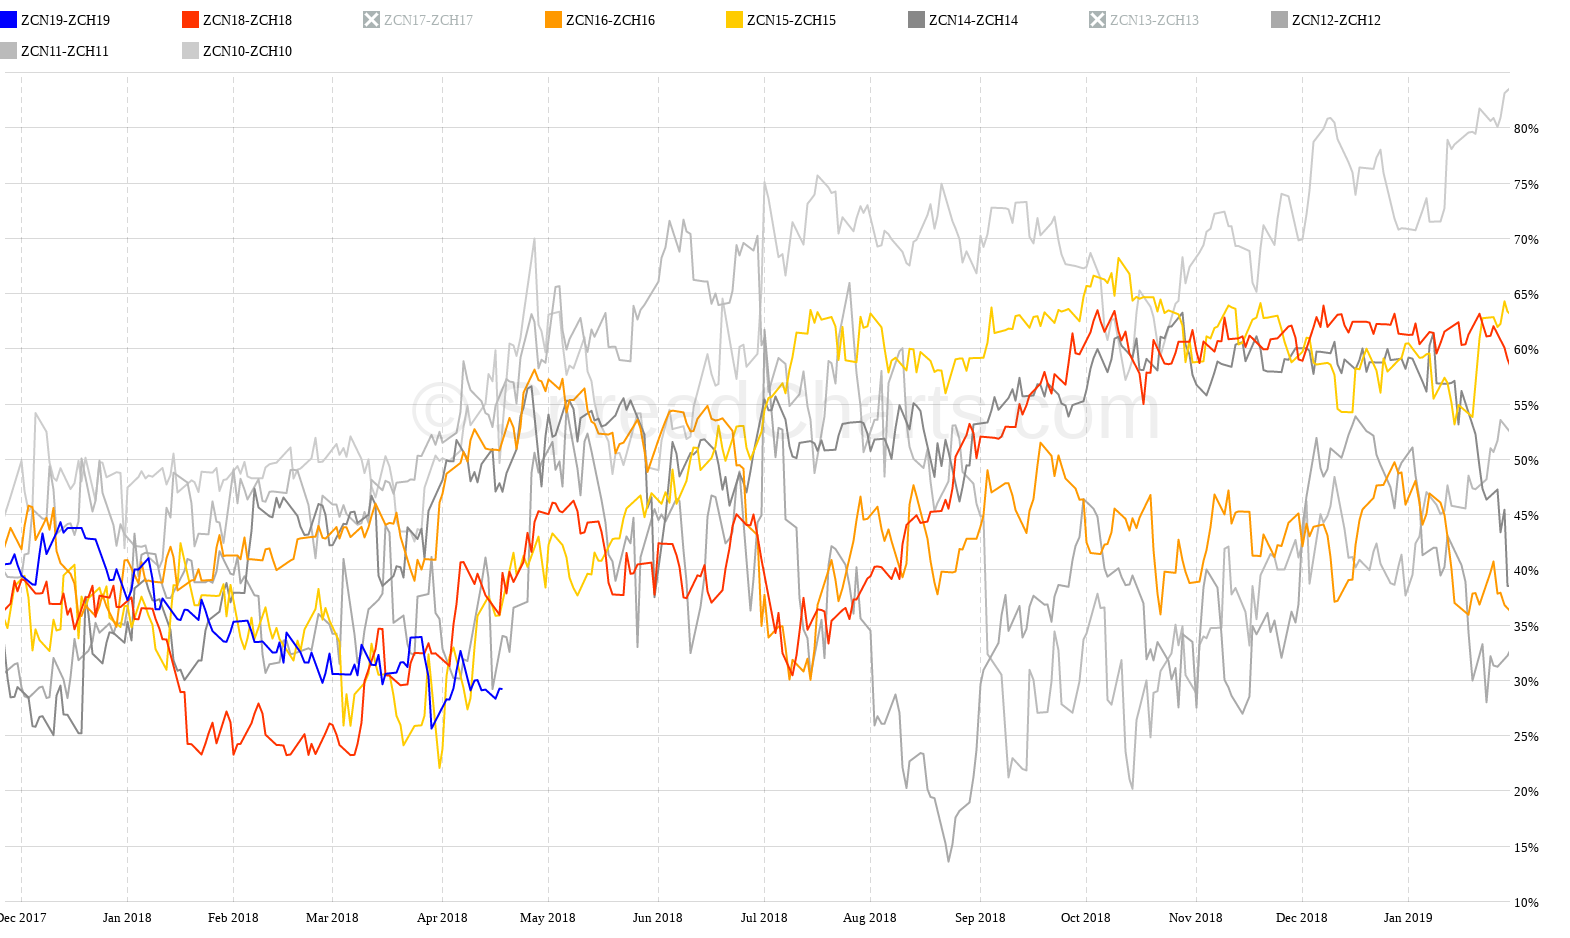
Of course, there are many possible combinations of spreads within a single crop. For example, March next year – December (currently ZCH19-ZCZ18) or July next year – March (ZCN19-ZCH19). These are narrower spreads with a lower risk.
What’s next?
Today I delved more into seasonality. It is undoubtedly an inseparable part of trading commodity spreads. However, it is crucial to use seasonality correctly. And we’ll look at it next time.
Check out these great articles as well
New data: Sector indices
Our software is already established well beyond commodity market analysis. Stock indices, currencies, and even...
Read moreWhat’s new in the SpreadCharts app?
It’s been a few months since we launched the new version of the SpreadCharts app....
Read moreA major new version of the app is here
Today, we’re excited to show you the major new version of the SpreadCharts app that’s...
Read moreLiberation Day!
Tariffs are arguably the dumbest part of Trump’s agenda. Yes, the goal makes perfect sense,...
Read more