Commodity Spreads 4: Why the interdelivery spreads exist?
In the last part of our series about commodity spreads, we have defined what a spread is and what types of spreads we have. Today we will look closer on interdelivery spreads because this type of spreads is perfectly suited to my account size and my risk tolerance. We will get to the benefits of spreads next time, but today I want to explain the basic – why the interdelivery commodity spreads exist?
Repetition
We already know that interdelivery spread is simply the price difference between two futures contracts within a single commodity. Let’s take an example. Corn delivered in March 2018 trades at a price of 349 cents (ticker of the futures contract is ZCH18). Corn with a delivery date in July trades at 365.5 cents (ticker is ZCN18). Spread, or the price difference between those two contracts is 16.5 cents (365.5 – 349 cents).
I think that is easy and understandable. But here is the question: How is it possible that spreads exist at all? Why do futures contracts for the same commodity have different prices? You often ask me about it on webinars, or through messages. That is why we will explain this in more detail today.
A company buying cocoa
Imagine that you are the Nestlé company, a manufacturer of chocolate and various sweets for the whole world. The main ingredient you need to make chocolate regularly is cocoa. Perhaps today you will realize that in three months you will need, say, 1000 tons of new cocoa. So, you have two options:
- Buy the cocoa right now and store it for three months.
- Buy cocoa futures with a delivery in three months (cocoa will be stored for three months by the supplier).
Storage costs
In both cases, the same quantity emerges – storage costs. In other words, if you store the cocoa yourself, it will cost you something. In order to store a physical commodity, you must have some space with suitable conditions. However, if you buy cocoa futures with a later delivery date, the supplier must store the commodity for you. And, of course, he will also incur some storage costs.
It does not matter whether the cocoa is stored by you or someone else, storage costs are always present. These costs, of course, must also be reflected in the price of the commodity, in the futures price. It is, therefore, quite common when futures contracts with some future delivery are more expensive. This normal state of the market is called contango, and its consequence is the existence of spreads.
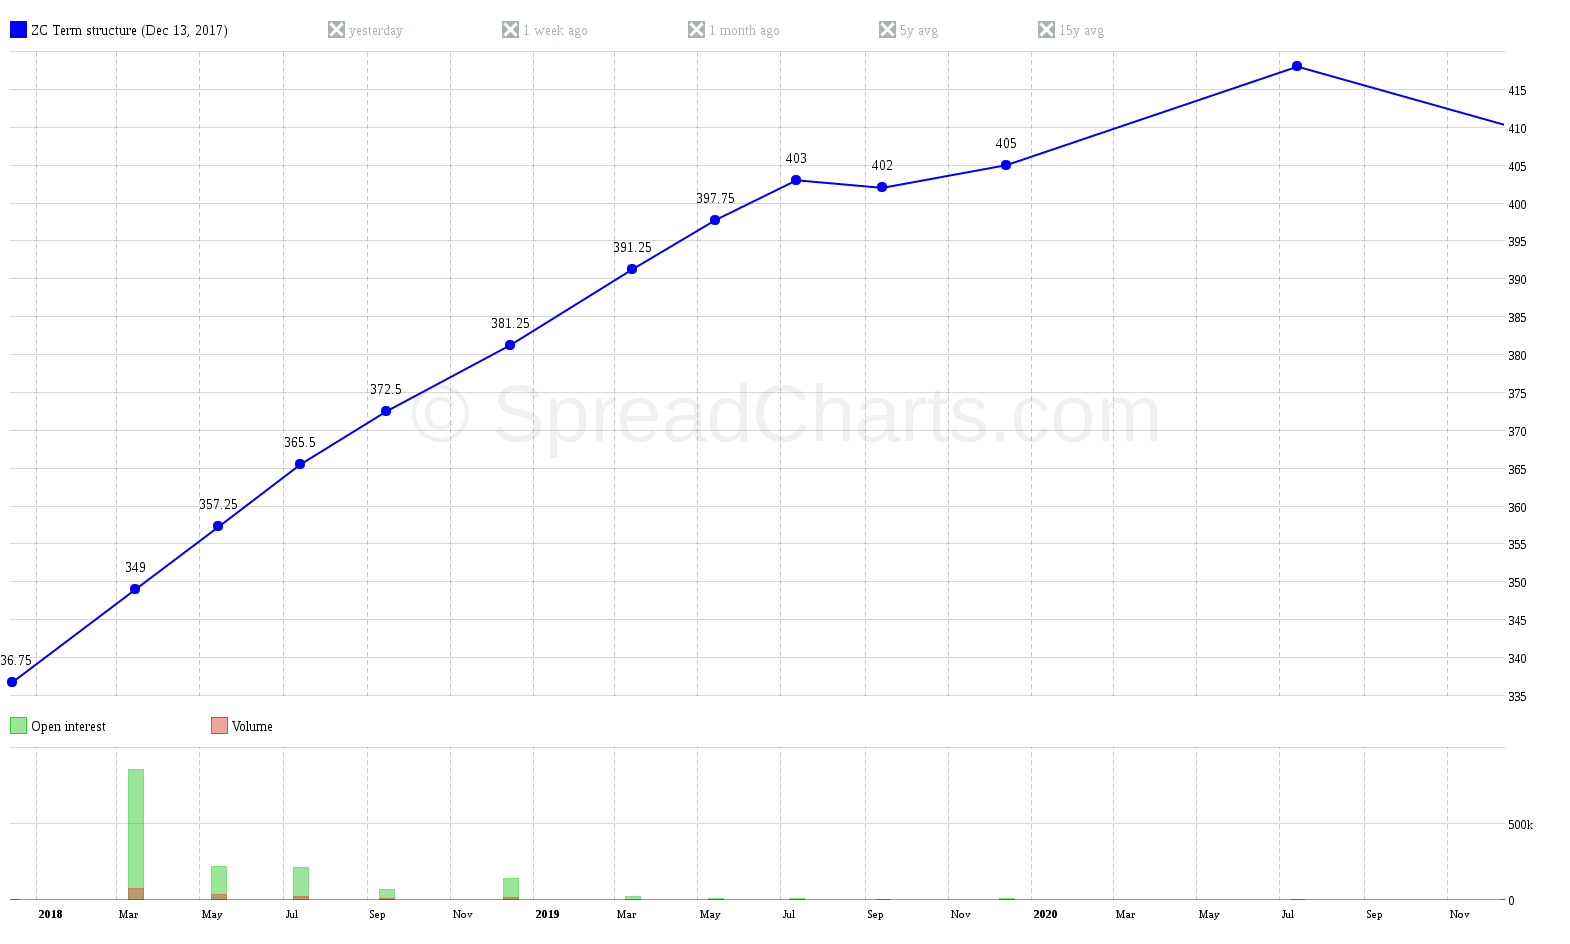
In the following chart, you can see a term structure curve that displays the prices of all traded futures contracts. It shows the distribution of commodity prices over all possible delivery dates. To be more specific, the term structure shows us the current distribution of supply and demand over some period. It is a very useful thing because we can identify harvests for grains, or heating season when it comes to energies, etc. I will get back to this later.
The chart shows term structure for corn on December 13th, 2017. It is obvious the market is in a normal state – in contango. Contract prices with more distant expirations are more expensive (horizontal axis – expiration, vertical axis – price). Also, as we have already said, one of the main reasons are storage costs.
Homework
For the next lesson, try to find on the term structure curve the spread that I have mentioned at the beginning of the article today. Mark it with an arrow on the chart, and next time we’ll check the result together.
What’s next?
In addition to the contango, we also know another market state – backwardation, which is also called an inverse market. I’m going to tell you something more about it next time. However, that’s not all. We will also talk about how it is possible that spreads can be negative and how we can deal with it.
Check out these great articles as well
New data: Sector indices
Our software is already established well beyond commodity market analysis. Stock indices, currencies, and even...
Read moreWhat’s new in the SpreadCharts app?
It’s been a few months since we launched the new version of the SpreadCharts app....
Read moreA major new version of the app is here
Today, we’re excited to show you the major new version of the SpreadCharts app that’s...
Read moreLiberation Day!
Tariffs are arguably the dumbest part of Trump’s agenda. Yes, the goal makes perfect sense,...
Read more