From COT report to COT analysis
COT report
The Commitments of Traders report is not only beneficial to us – spread traders, but also for outright futures traders, currency traders, etc. COT reveals what’s behind the curtain. It gives us the information we’re unable to obtain from news and other common sources. We can determine whether the market is overbought or oversold, based on the positions of big market participants who actually move the market. The Commitments of Traders is like a sentiment poll, only with actual dollars, not just opinions. Which is good, because money doesn’t lie.
If you’ve ever seen a raw COT report, you probably got scared off. It contains a huge number of rows and more than a hundred columns, so you could literally drown in numbers. If you haven’t seen the raw version yet, you can find it on the CFTC website under Market Reports -> Commitments of Traders -> Historical compressed.
The following picture is a very shortened version of the COT report for silver. Although it’s only a shortened version of the report, it still contains a lot of numbers. Try to find the number of short positions of the hedger’s group (which includes producers, processors, …). You would certainly find this number after spending some time browsing the table. The hedgers have 55,982 short positions on October 27th in silver.
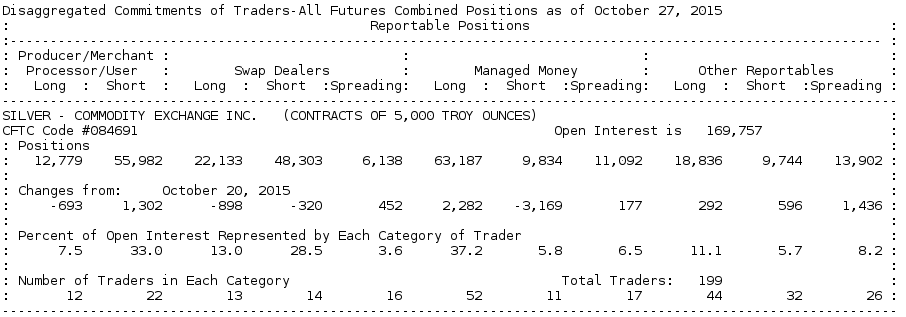
Well, we’ve found the number. But what’s next? Can I determine anything from just one number? In fact, no. To understand in what state the market is, we have to examine how this number changes over time. We would have to record these numbers in a table each week and make a chart from it. Then it would be useful.
COT analysis
Fortunately, we don’t have to do this ourselves. There are several apps that can do this for us, such as SpreadCharts.com. This way I can see the positions evolve over time at first glance. COT is very important to me and I even consider it to be a key pillar of my trading approach.
Let’s take a look at two the following images that represent COT analysis for silver. The first image shows positions of the large speculators and the second image positions of the hedgers. In the case of speculators, local maxima of the green curve correlate with local peaks in price. Inversely for hedgers, local minima of the red curve correlate with local peaks in price.
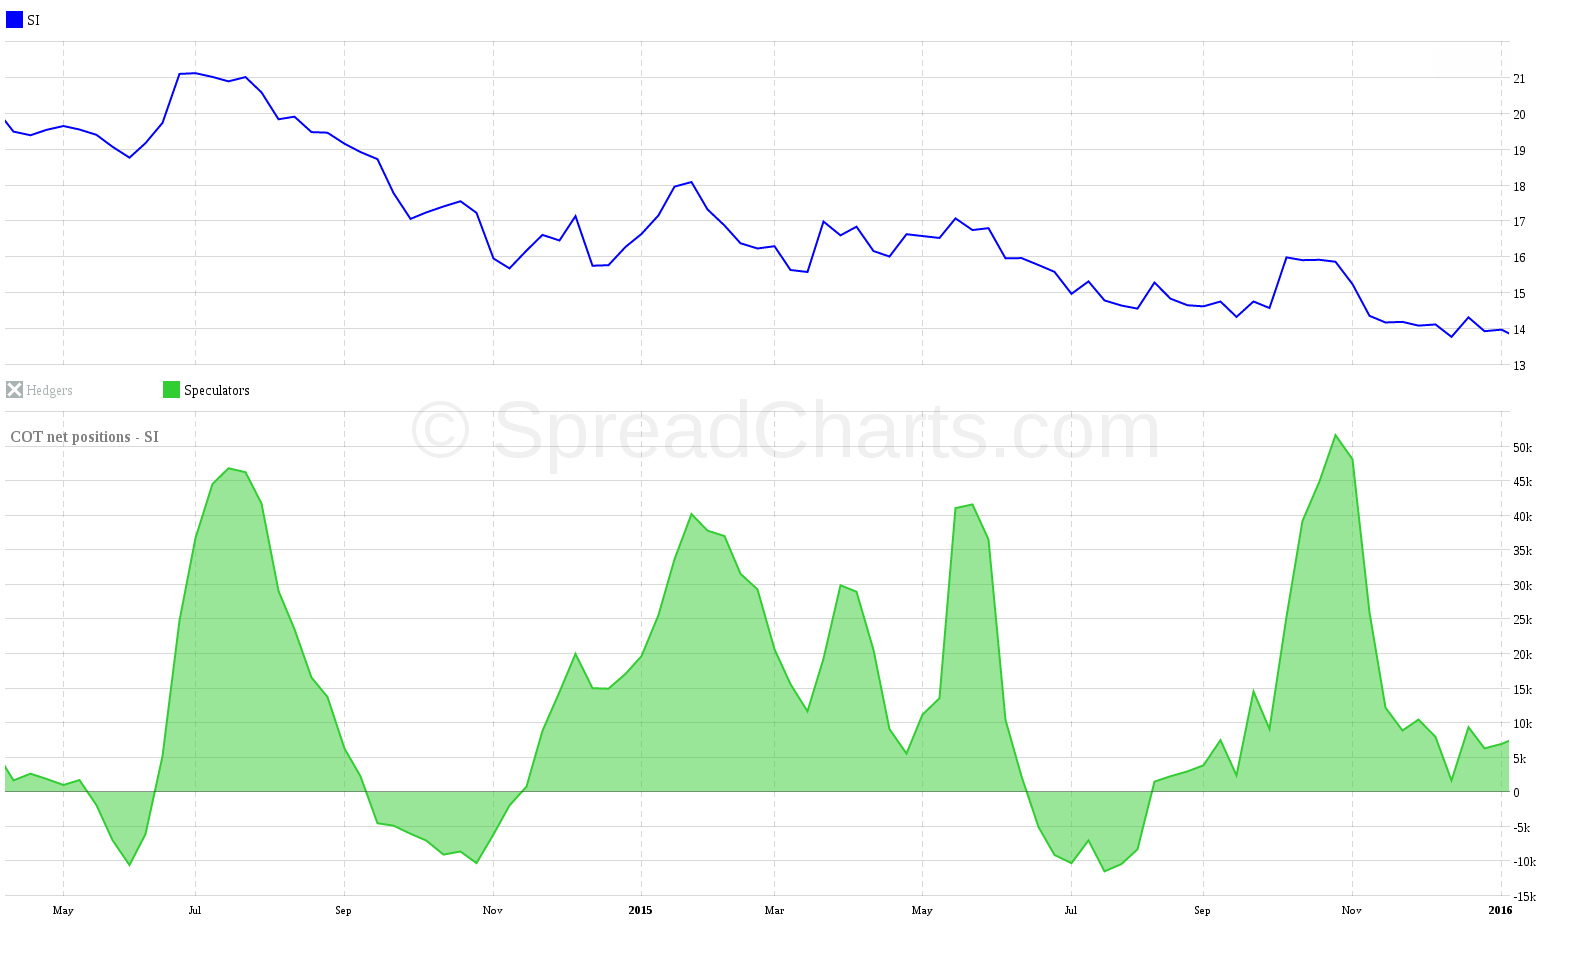
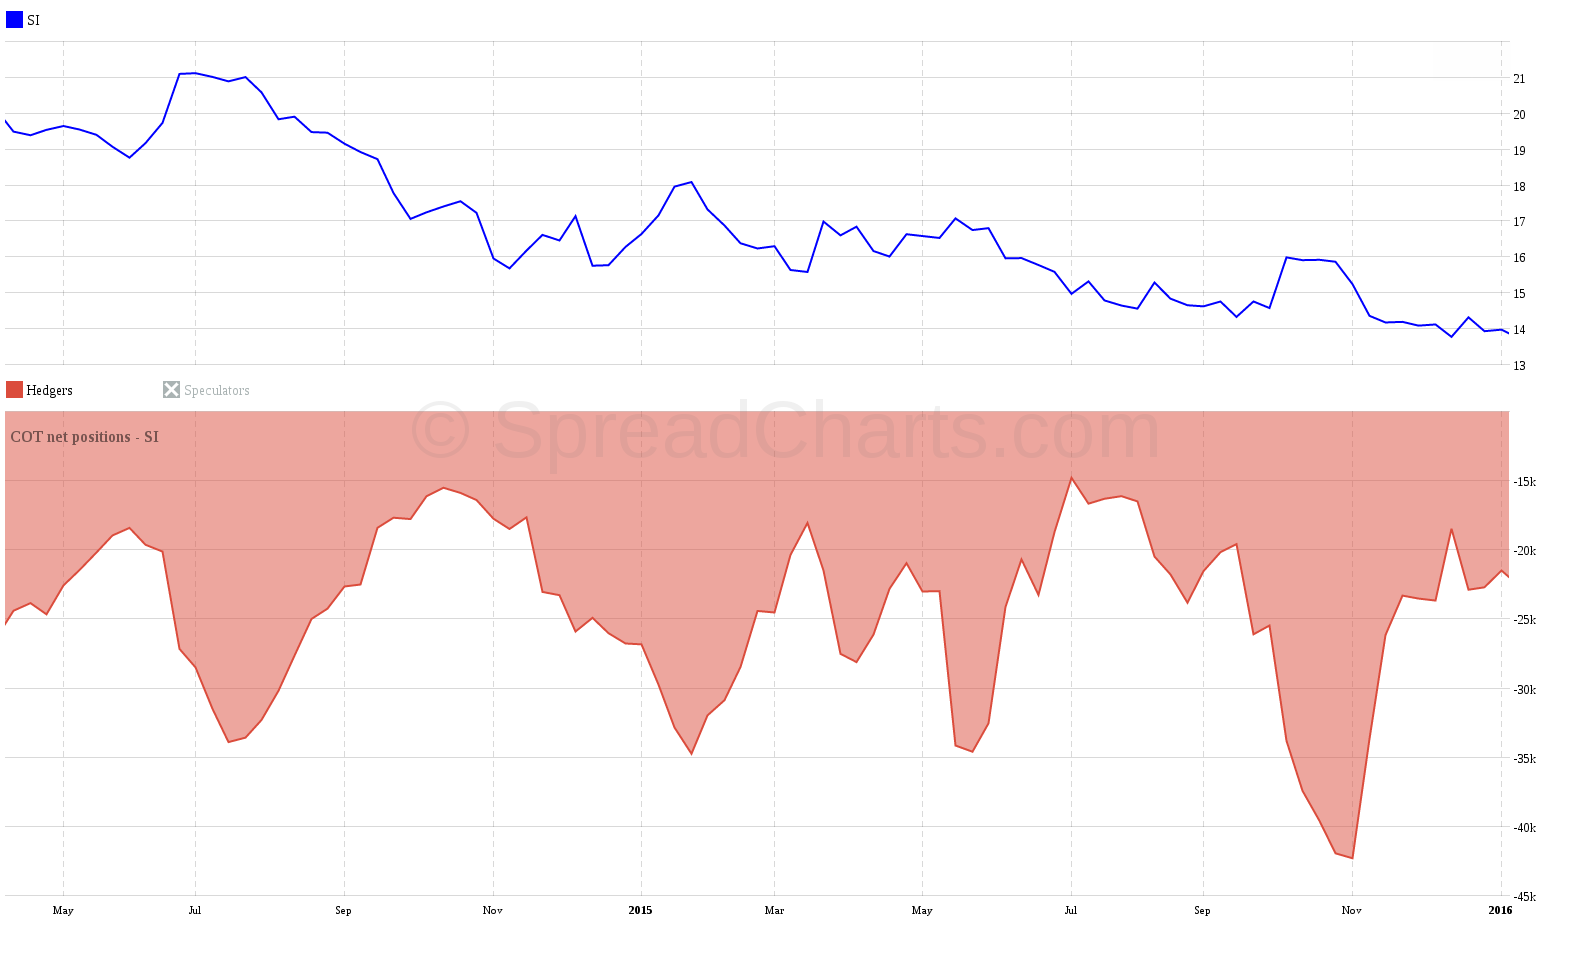
As you can see, COT analysis reveals to us how positions of the largest players evolve over time. And that’s exactly what a trader needs to know. We don’t need to remember specific numbers. Changes in positions, put in context with the previous history, is an important thing in your trading. We can make decisions whether the market is overbought or oversold based on these charts.
Some people get burned using COT and become convinced it doesn’t work very well. However, the problem is usually in wrong interpretation of the COT data. The Commitments of Traders is not a precise timing indicator. It’s published weekly (on Friday showing Tuesday’s data). Also, an overbought/oversold market can become even more overbought/oversold. This explains why the signal from COT analysis can take effect in price after several weeks. And ultimately nothing works 100% of the time, even COT doesn’t.
Despite all of these pros and cons, the Commitments of Traders is an invaluable piece of information you can’t get from price or any other indicator. It constitutes an indispensable part of my trading system. It offers a glimpse into the activity of the smart money. They truly move the price and therefore also affect my positions and money.
Check out these great articles as well
New data: Sector indices
Our software is already established well beyond commodity market analysis. Stock indices, currencies, and even...
Read moreWhat’s new in the SpreadCharts app?
It’s been a few months since we launched the new version of the SpreadCharts app....
Read moreA major new version of the app is here
Today, we’re excited to show you the major new version of the SpreadCharts app that’s...
Read moreLiberation Day!
Tariffs are arguably the dumbest part of Trump’s agenda. Yes, the goal makes perfect sense,...
Read more