
 Pavel Hála
Launching indicators
Technical indicators are the favorite tool of roughly 95% of traders.
Well, I’m in the other 5%. I’ve never been a fan of technical indicators as they don’t bring any new information to your analytical process. They are derived from price only; hence, in principle, they can’t add anything that isn’t already contained in the price.
That said, I understand that expressing price action through indicators can be helpful to many people. Therefore, we’re launching technical indicators in the SpreadCharts app today.
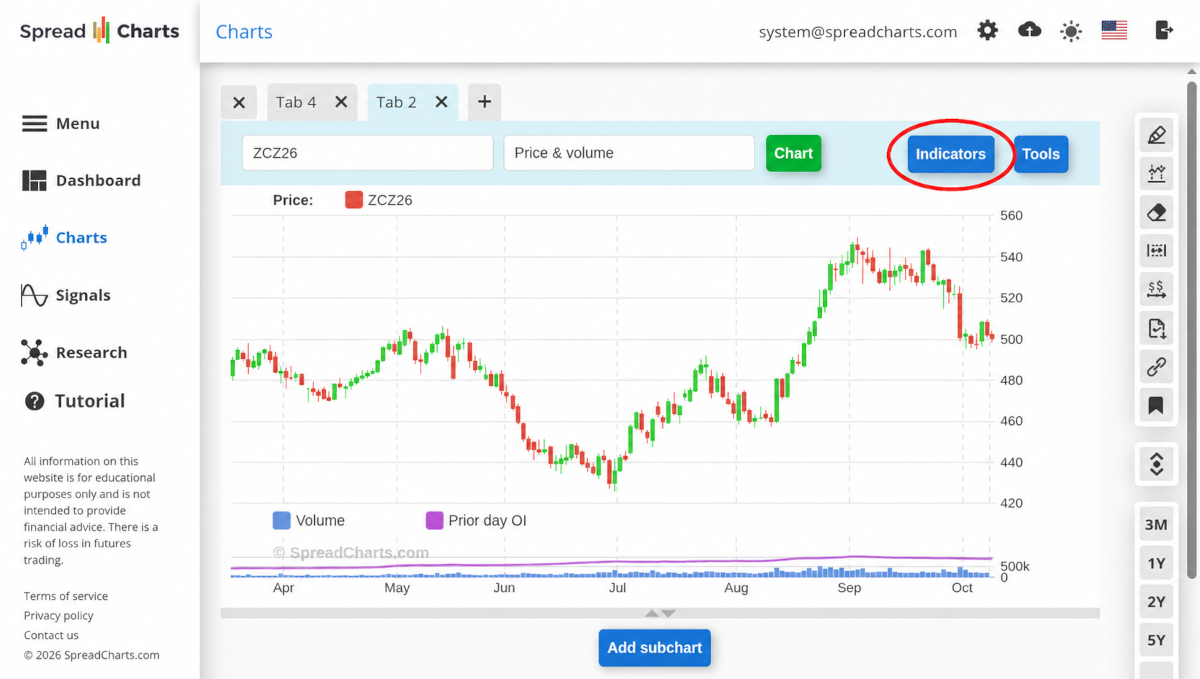
You’ll find the new “Indicators” button right next to the tools. It will be active for all price charts.
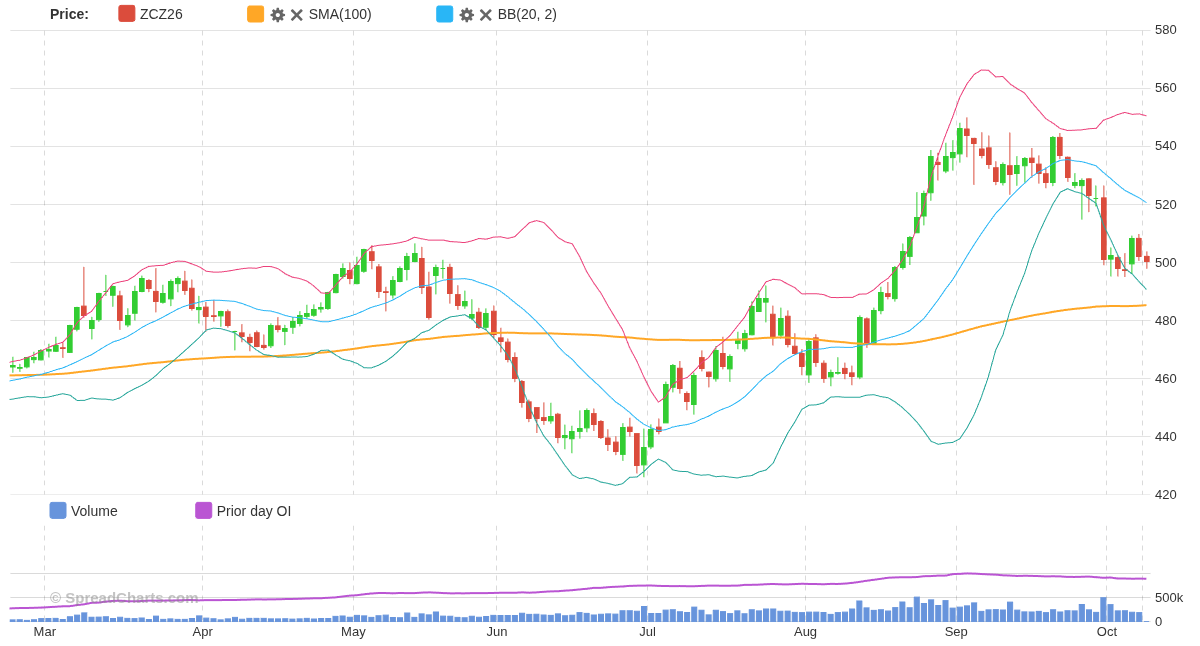
And which indicators can you choose from? Let’s start with the simplest ones, like moving averages, which are actually the most useful. This is also true for Bollinger Bands.
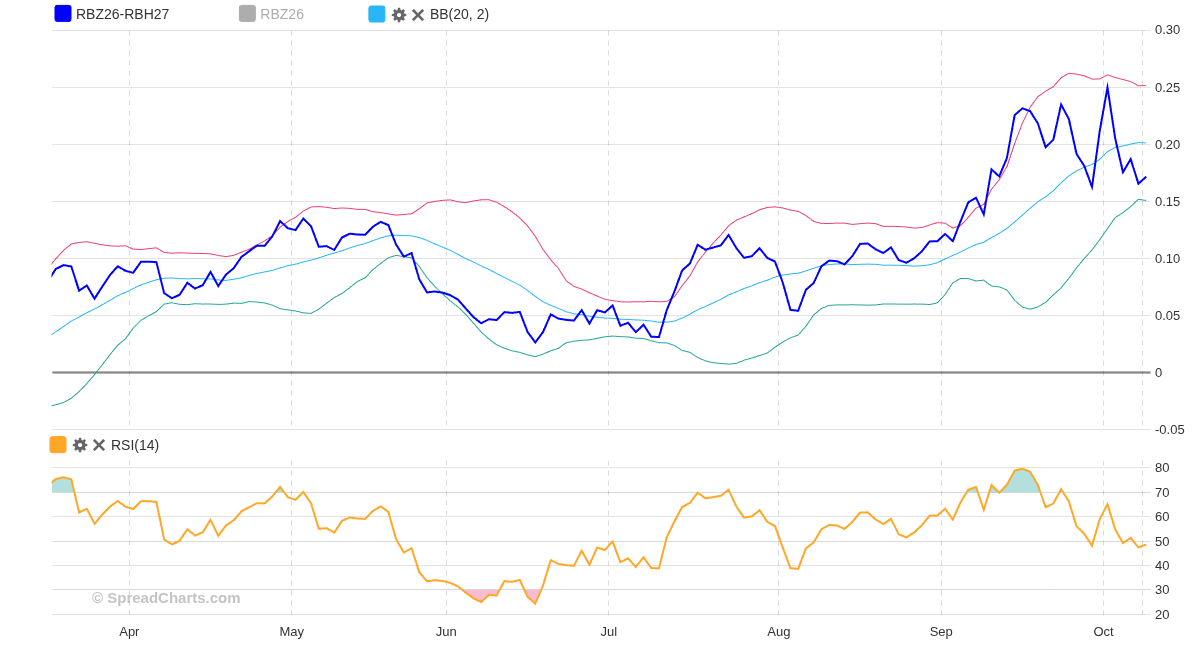
In addition to overlaid indicators, you can also add more complex indicators like RSI and MACD in separate panes. And you can plot these indicators for interdelivery spreads and ratios as well.
You can have up to 10 indicators in each subchart. Just be careful if you apply them to continuous contracts, as they often have decades of history, and rendering such a chart with too many indicators can take some time, depending on your device. Due to this computational demand, the indicators do not recalculate when candle aggregation changes; i.e., the indicator periods always apply to the daily timeframe.
We do not rule out adding more indicators in the future, but only if many users express such a desire or the request comes from one of our enterprise customers. Frankly, the indicators we launched today are more than enough for 99% of use cases. More complex indicators won’t give you any edge, as they’re still just derived from price.
P.S. Don’t forget to clear your browser’s cache or at least reload the app with Ctrl+Shift+R to fetch the new version with indicators.
Check out these great articles as well
Pavel HálaQuarterly macro outlook and review
We’ve just released the new Quarterly Macro Outlook, covering the latest trends in interest rates,...
Read morePavel HálaNormalized COT
We added a neat new feature for Commitments of Traders data. You can now normalize...
Read morePavel HálaNew data: Rates and electricity
As promised, we’re adding new data to the SpreadCharts app. Importantly, the goal is not...
Read morePavel HálaNew data: Sector indices
Our software is already established well beyond commodity market analysis. Stock indices, currencies, and even...
Read more