New chart: Continuous histogram
We have deployed a new version of SpreadCharts today. In the article from the beginning of the week, we introduced you to all the new features except one. This is a new chart, and this time it is a really powerful tool.
We used to have the so-called Contango histogram in the app. It was sort of a legacy chart from the old app, limited to show contango distributions of just a few predefined combinations of continuous contracts. I originally came with this idea for my own trading more a decade ago and have been using this especially for mean-reverting quantities like contango.

This legacy chart is now being replaced by Continuous histogram that finally unlocks the full potential of this study. The intention remains the same – to visualize the distribution of market data using the histogram chart. However, the calculation itself has been reworked from the ground up. I will present to you its features one by one.
Advanced statistical functions
Here’s the contango distribution between the first two continuous contracts in coffee over the past 20 years. First of all, there’s the distribution itself (blue columns) and the last value (vertical blue line) centered on the nearest column. Together, they allow you to compare the current contango value to the historical distribution. The levels of high density (clusters of tall columns) tend to act as an attractor to the price. On the other hand, the valleys may serve as supports and/or resistances.
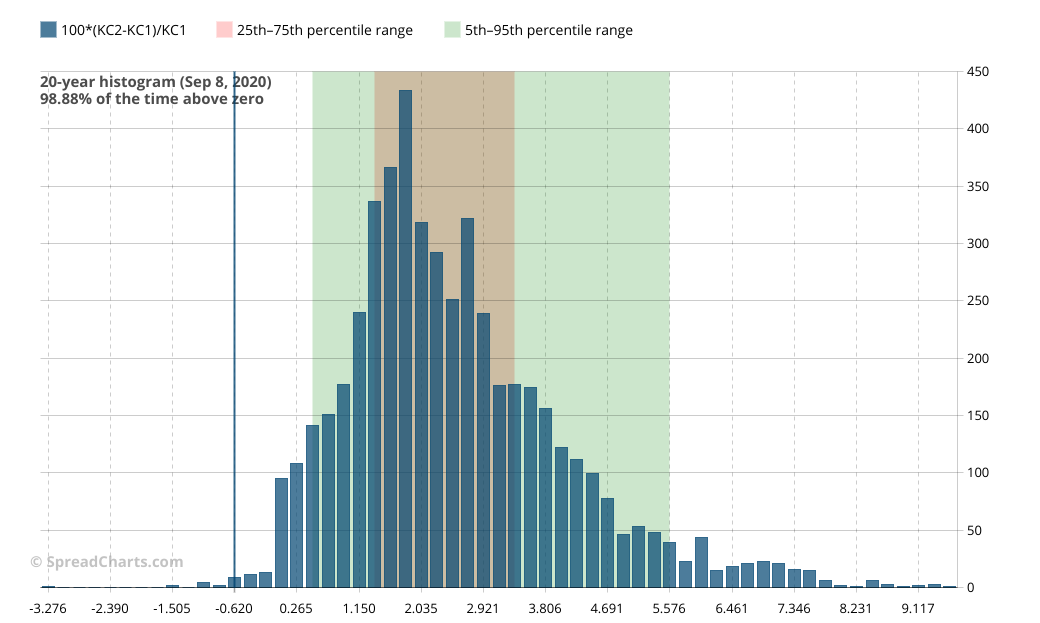
I’m sure you also noticed the red and green areas. These are very helpful and will help you to speed up your analysis. The red-colored area shows the 25th to 75th percentile range. It means 25% of the lowest values are located to the left side of it and 25% of the highest values to the right side of it. The red area basically highlights the region where the contango tends to return because it’s mostly made up of 50% of the most common observations.
The green-colored area shows the 5th to 95th percentile range. The logic is the same as before but the application is different. I recommend using this green range to identify extremes. Seeing the contango out of the green region is very rare. So if that happens, as you see for example on the chart above, the market is definitely overbought/oversold and there is a decent likelihood of mean reversion. That’s because only 5% of the highest values and 5% of the lowest values are out of this region. Just keep in mind that not just the last value (vertical blue line) but also the red/green region boundaries are centered on the nearest column. Their precision is, however, sufficient for this analysis.
Another handy tool is the frequency of positive values in the data set. You’ll find this in the top left corner of the chart and only if there are negative values in the data (otherwise it’s omitted). In our example, there is “98.88% of values above zero”. These statistics can be very helpful. In this particular example, it can tell us which spread strategy has a better chance to be successful. Contango has been overwhelmingly dominant in the coffee market and that’s a great environment for bear spreads.
Versatility
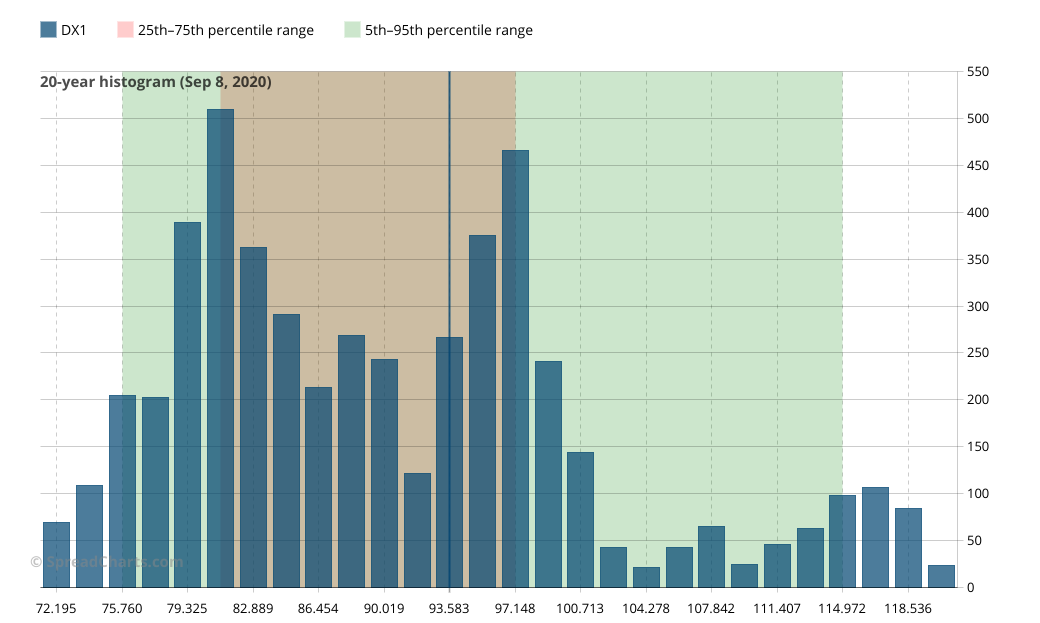
You can visualize whatever price data you want. Even the price itself. Here’s the 20-year distribution of the first continuous contract on the Dollar index. Of course, you’re no longer restricted just to continuous contracts. You can select specific futures contracts. It that case, it’s the continuous price that’s used as input data.
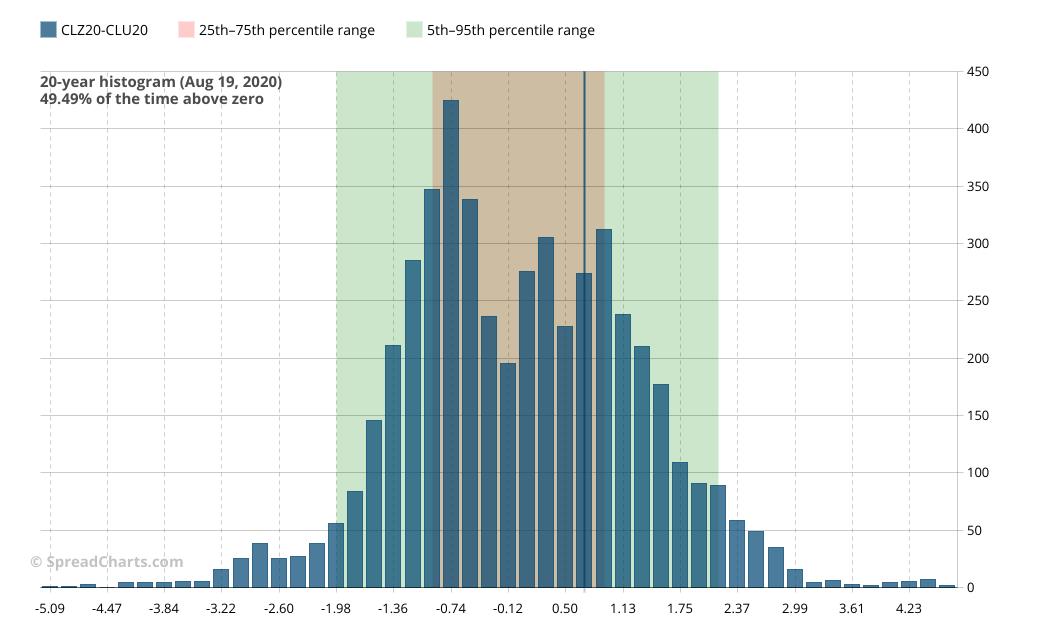
There is one use case where this option to use specific contracts gives you a tremendous advantage. It’s the visualization of the historical spread price distribution. If you’re interested in a histogram for a particular spread combination, you can’t use continuous contracts because they can greatly distort the reality. It’s clearly explained in the example with natural gas at end of the article about continuous price chart. Let’s say you want to see histogram for CLZ20-CLU20 spread in crude oil. No problem now:
But we’re not stopping here, there’s much more value this analysis can bring to you. What about fundamental ratios? Here’s the 46-year distribution of gold/silver ratio which is carefully watched by precious metals investors. This study is perfect for this kind of data.

And finally, let’s go extreme. What about the 5-year distribution for 3-2-1 crack spread?
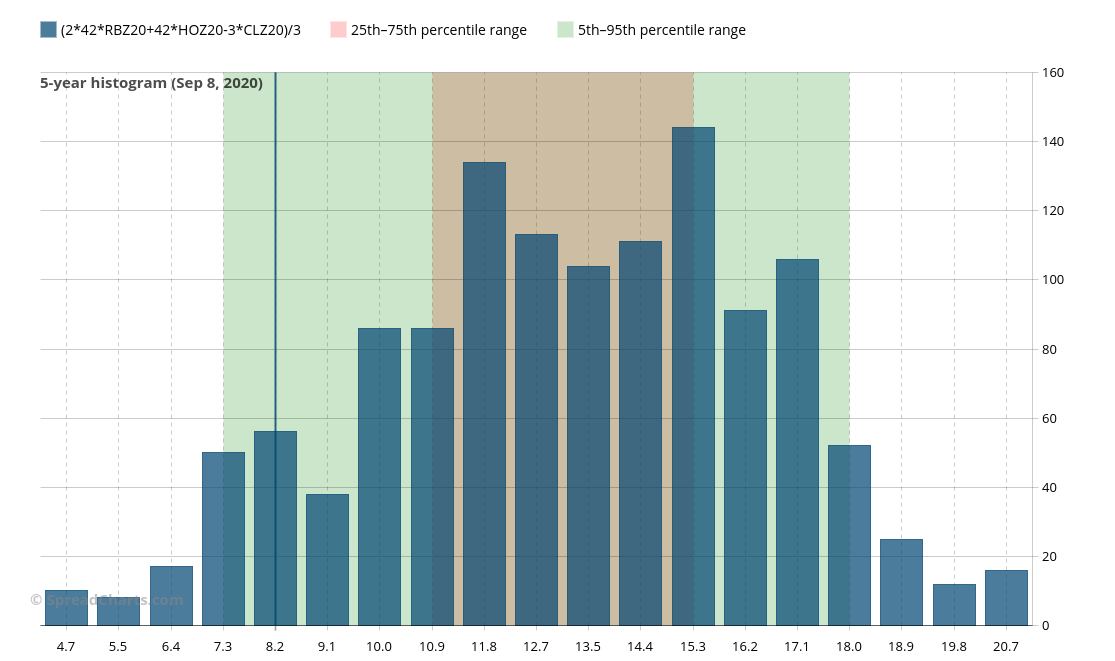
As you can see, there are no limits to what you can visualize.
Combinations with other charts
To give you better insight into the data, we allowed the histogram to be plotted together with any other chart. It makes the most sense to display the histogram together with the underlying data. I’ll show you what I mean in the next chart. The top subchart is the continuous histogram for ZWZ20-ZWU20 wheat spread. Just below it is the continuous price for the same spread.
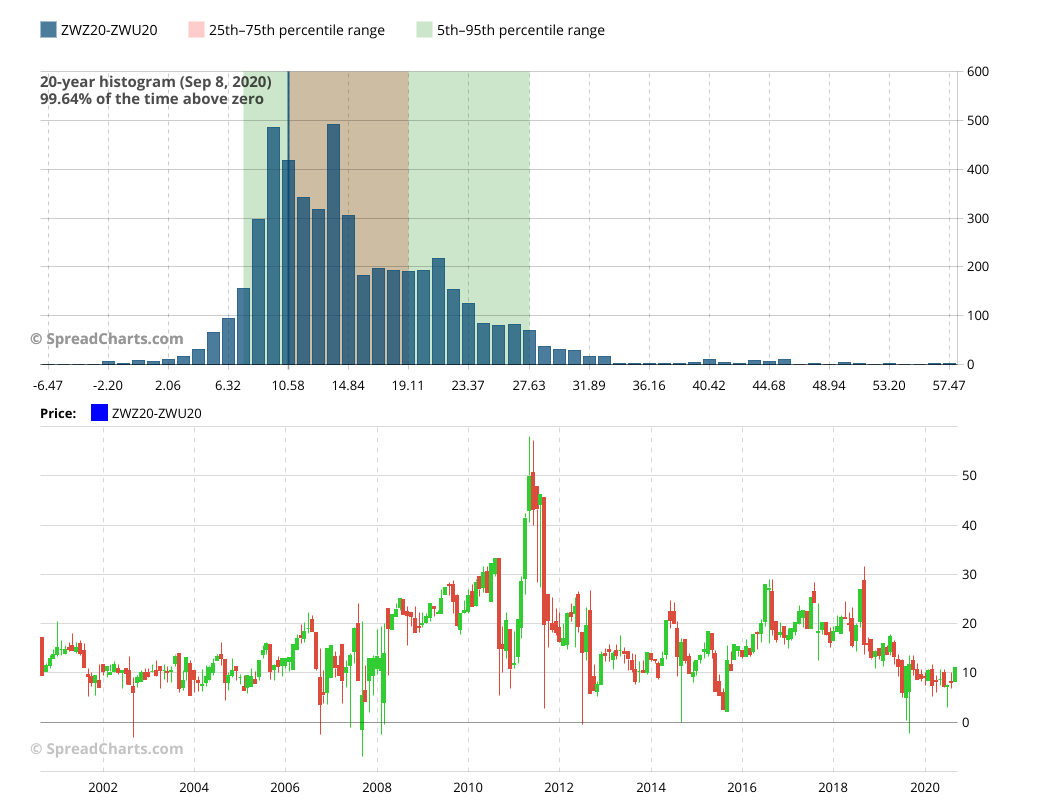
The charts are synchronized. If you change the zoom, the bottom continuous price subchart will scale accordingly and the histogram will immediately show you the distribution of the data. To keep the data synced, the mouse zoom is disabled, so you have to use the buttons in the right zoom panel.
The histogram gives you statistical properties of the data set and the price chart is helpful for analysis of the finer details. This setup can help you immediately identify the periods of the extremes from the histogram. These two charts are a perfect fit.
Get the information advantage!
The new continuous histogram is a groundbreaking feature. It won’t just save your time but also reveal important data properties you would otherwise miss. Due to the advanced character of this study and computational time involved, the new histogram chart will be available only to our premium users. The only exception is CBOT Corn contracts (including interdelivery spreads) for which you can use it freely to get a taste of this powerful chart.
Do you want to become a premium user and get full access to the histogram, trading signals powered by AI, and premium research of the best opportunities in the markets?
Then subscribe in the app (gear in the top right corner) or on our website.
Check out these great articles as well
New data: Rates and electricity
As promised, we’re adding new data to the SpreadCharts app. Importantly, the goal is not...
Read moreNew data: Sector indices
Our software is already established well beyond commodity market analysis. Stock indices, currencies, and even...
Read moreWhat’s new in the SpreadCharts app?
It’s been a few months since we launched the new version of the SpreadCharts app....
Read moreA major new version of the app is here
Today, we’re excited to show you the major new version of the SpreadCharts app that’s...
Read more