Commodity spreads 9: Spot price
In the last part of our spread series, I promised you to take a look at the process of assembling a spread position. However, I have realized, that we haven’t gone through one very important thing – the convergence of futures contracts to the spot price. This is a key element to understand the direction of the spread movement.
What we already know
- What are the spreads
- Why interdelivery spreads exist
- How to trade the spreads
- How is it so that interdelivery spreads change?
Today, we will add another fundamental principle – convergence of the term structure curve to the spot price. If you have never heard the word “spot price”, don’t be afraid, I will explain everything.
Spot price
Let’s get back to the futures contracts. Their price reflects supply and demand in the future (including storage costs). On the contrary, the spot price determines the price of a commodity with instant delivery. It’s the same as when you realize that you need tomatoes for you lunch immediately. You go to the store and buy it. Using the language of commodity markets – you buy tomatoes at a spot price.
However, it’s not so easy because there are many spot prices. Just as tomatoes are sold in many grocery stores in your area (and for different prices), there are also many physical markets for the particular commodity. Spot prices can, therefore, vary locally. For example, one cannot say that the current spot price of corn is $ 4 per bushel.
In fact, a spread trader does not even need to know the spot price exactly. What is more important is to know where the spot price roughly is:
-
If the market is in contango, the spot price is usually under the term structure curve. If the market is in backwardation, the spot price is usually above the term structure curve.
Overall, it is logical. If we want to buy corn immediately, there is no need to store the commodity. Therefore, the seller doesn’t have to include storage costs. Thus, if the market is in the normal state, that means there is a sufficient inventory of corn and the term structure is in contango, there is no reason why the spot price should be higher than the price of the futures contracts. Therefore, it is usually under the term structure curve.
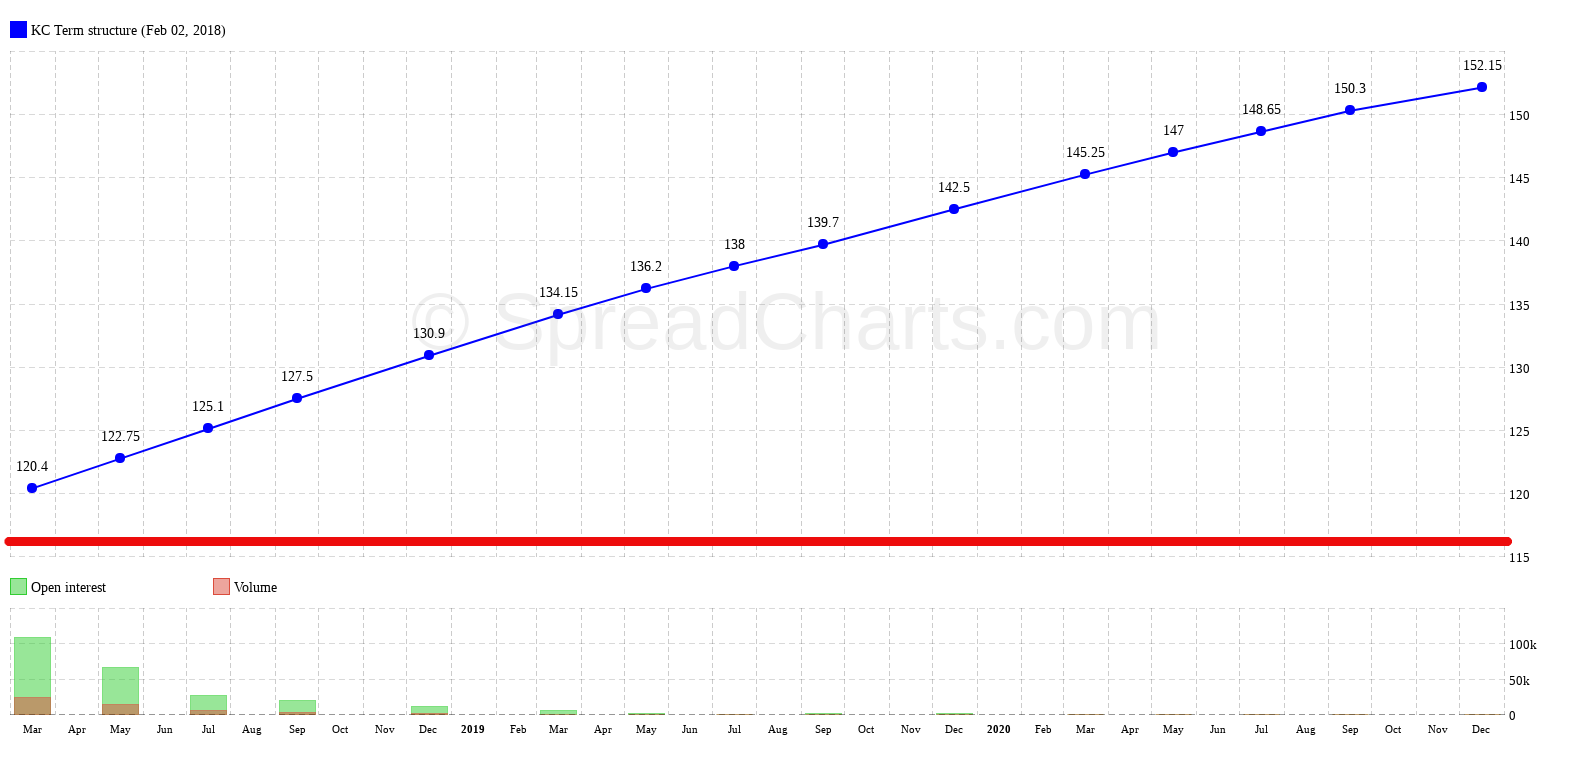
The red line shows the expected position of the spot price.
But if the market is in backwardation, the situation is different. As I have already described, backwardation will occur if demand for the commodity suddenly increases or there is a problem on the supply side. In such a situation, buyers want to secure a smooth delivery of the commodity and are willing to pay for it. This is why the prices of nearest futures contracts are higher, and logically the commodity with the nearest delivery is the most expensive. For this reason, the spot price, in this case, is mainly situated above the term structure.
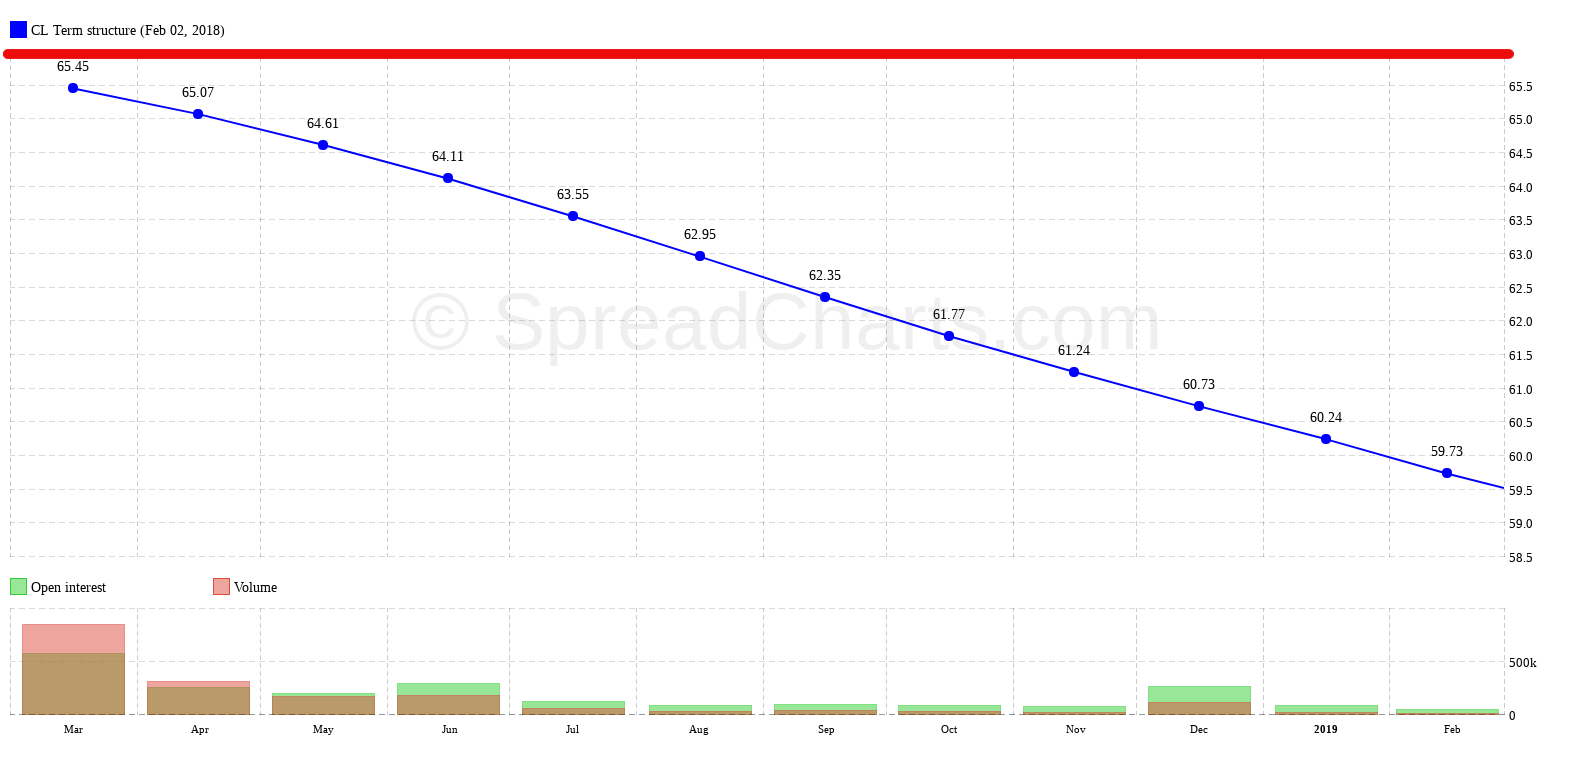
The red line shows the expected position of the spot price.
Spot price as a magnet
And now the relationship with spreads. The spot price acts on the term structure curve as a magnet. And as you know, the magnet attracts the closer objects more than the distant ones. Similarly, the spot price attracts the entire term structure curve, but the nearest contracts are affected the most. More specifically, the term structure curve tends to converge to the spot price. The nearest contracts, however, tend to converge faster than those more distant.
Do you remember the rubber band from the last part of the series. When the rubber band stretches out, the distance of two points on the rubber band increases and vice versa. So when some part of the term structure moves faster, the term structure is expanding or shrinking. This effect also causes the movement of our interdelivery spreads.
What’s next?
Maybe you already know what the connection between convergence to the spot price and two different spread strategies is. And by spread strategies, I mean bull and bear spreads. Try to think about it, we will discuss it next time.
Check out these great articles as well
New data: Sector indices
Our software is already established well beyond commodity market analysis. Stock indices, currencies, and even...
Read moreWhat’s new in the SpreadCharts app?
It’s been a few months since we launched the new version of the SpreadCharts app....
Read moreA major new version of the app is here
Today, we’re excited to show you the major new version of the SpreadCharts app that’s...
Read moreLiberation Day!
Tariffs are arguably the dumbest part of Trump’s agenda. Yes, the goal makes perfect sense,...
Read more