
 Pavel Hála
Normalized COT
We added a neat new feature for Commitments of Traders data. You can now normalize COT data using either min-max normalization or a z-score applied over a rolling period.
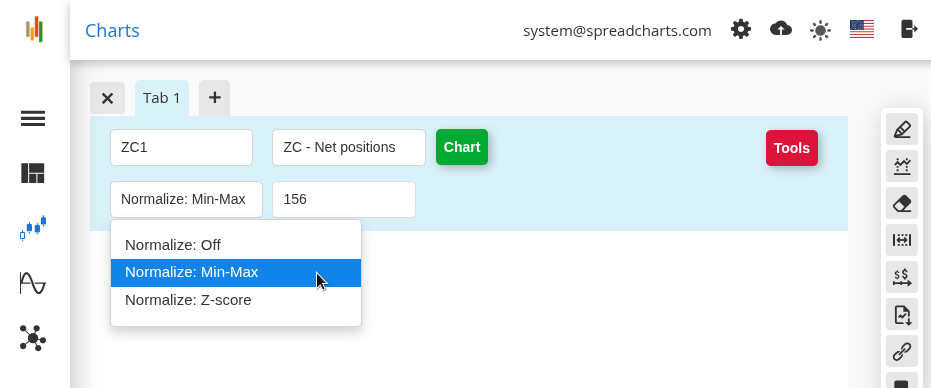
After selecting COT for a valid input contract (an actual or continuous contract), open Tools, turn on normalization, and enter your preferred rolling window period. The default is 156 weeks.
Min-max normalization, in particular, is popular among traders who use it to detrend COT data. For example, here is what normalized net positions for corn look like.
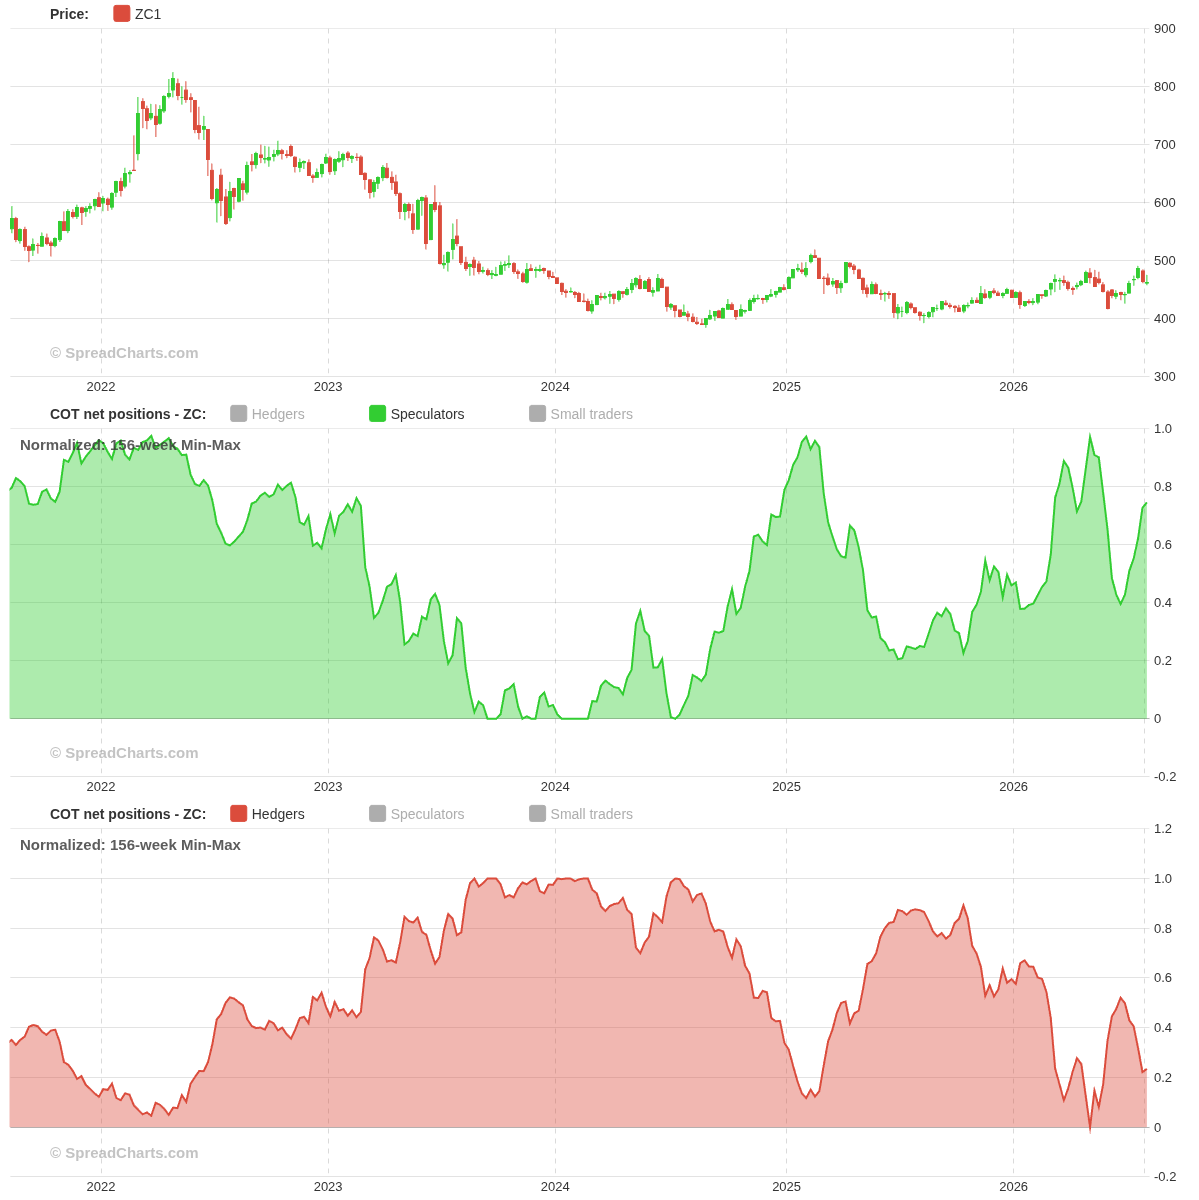
Frankly, I’m not a fan of normalized COT charts. Yes, normalization makes the charts look nicer, but you can achieve basically the same thing by zooming in on a specific period, as the y-axis range rescales automatically.
Normalizing the data also has a clear downside: it removes some of the finer information contained in the original data. For example, the fact whether a particular group is actually net long or net short. It can also distort the data by creating artificial trends that do not reflect changes in the underlying data but merely result from the rolling window shifting into a less volatile period.
So why are we adding this feature now?
The only use case where normalization truly makes sense is in automated systems. For example, we normalize the COT data used as an input for our Signals at SpreadCharts. And there seems to be a growing number of algorithmic strategy developers who use SpreadCharts for higher-level analysis and, of course, read our outstanding Research.
These users increasingly wanted to display COT data in the same way it is fed into their systems, either to check the data or verify its usefulness in a particular market. That’s a valid use case, so we heeded their requests and added this normalization option.
Don’t forget to use Ctrl+Shift+R or clear your browser cache to fetch the latest version of the app. Otherwise, the new COT normalization feature may remain hidden from you.
Check out these great articles as well
Pavel HálaLaunching indicators
Technical indicators are the favorite tool of roughly 95% of traders. Well, I’m in the...
Read morePavel HálaQuarterly macro outlook and review
We’ve just released the new Quarterly Macro Outlook, covering the latest trends in interest rates,...
Read morePavel HálaNew data: Rates and electricity
As promised, we’re adding new data to the SpreadCharts app. Importantly, the goal is not...
Read morePavel HálaNew data: Sector indices
Our software is already established well beyond commodity market analysis. Stock indices, currencies, and even...
Read more