
 Pavel Hála
New data: Rates and electricity
As promised, we’re adding new data to the SpreadCharts app. Importantly, the goal is not to have data for 100 markets instead of 93 just for the sake of reaching a round number, but to add data that provides a real edge to our users.
I will give you a few examples below. If you need the full contract specifications, you can find them on the CME Group product website or its equivalent at ICE.
The first example is the 10-Year Yield futures contract with the ticker 10Y. You might argue that we already have data for 10-Year Treasuries – the incredibly liquid ZN contract. However, the ZN contract shows the price of the bond itself, while the 10Y contract follows the yield. In practice, they mirror each other, as the chart below demonstrates.
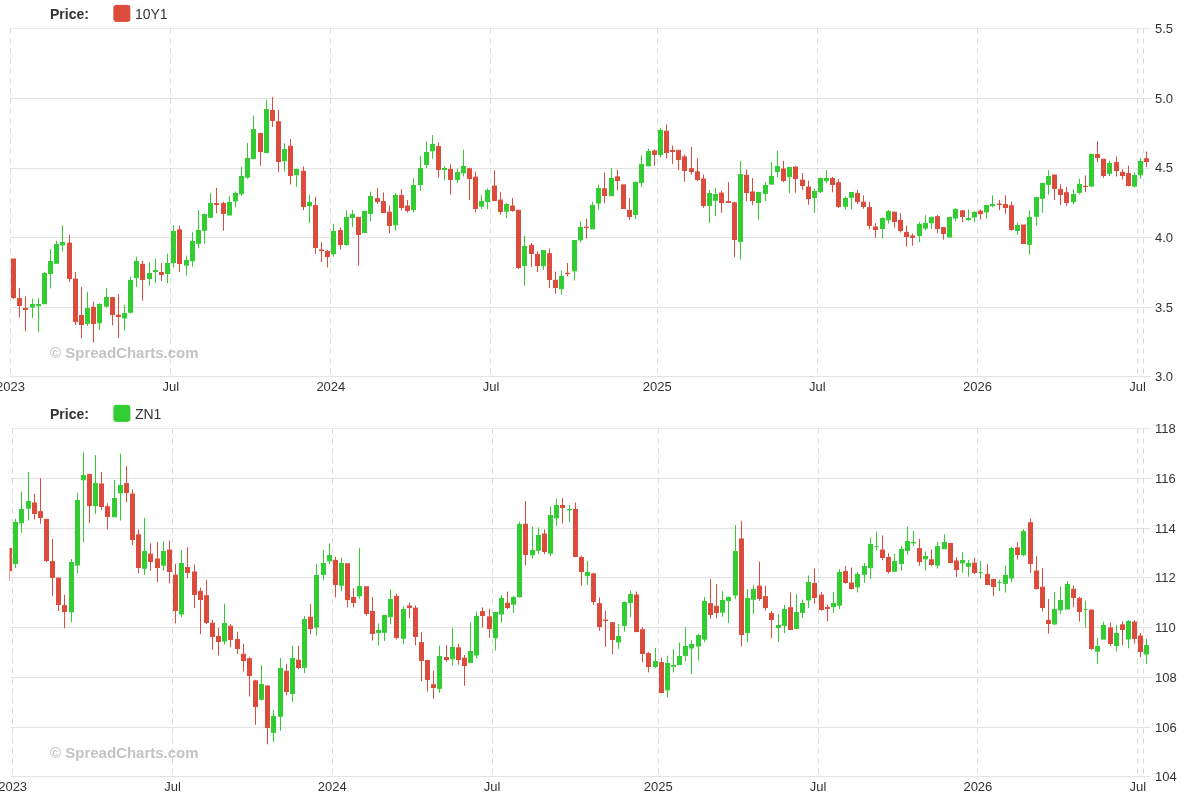
But how useful is the new contract? Well, Treasuries are a huge market affecting currencies, equities and commodities. So it is necessary to keep an eye on bonds. And now you can follow the 10-year yield itself.
For example, the next chart shows what I call rate-sensitive proxies, comparing the cyclically sensitive copper/gold and oil/gold ratios with the 10-year Treasury yield.
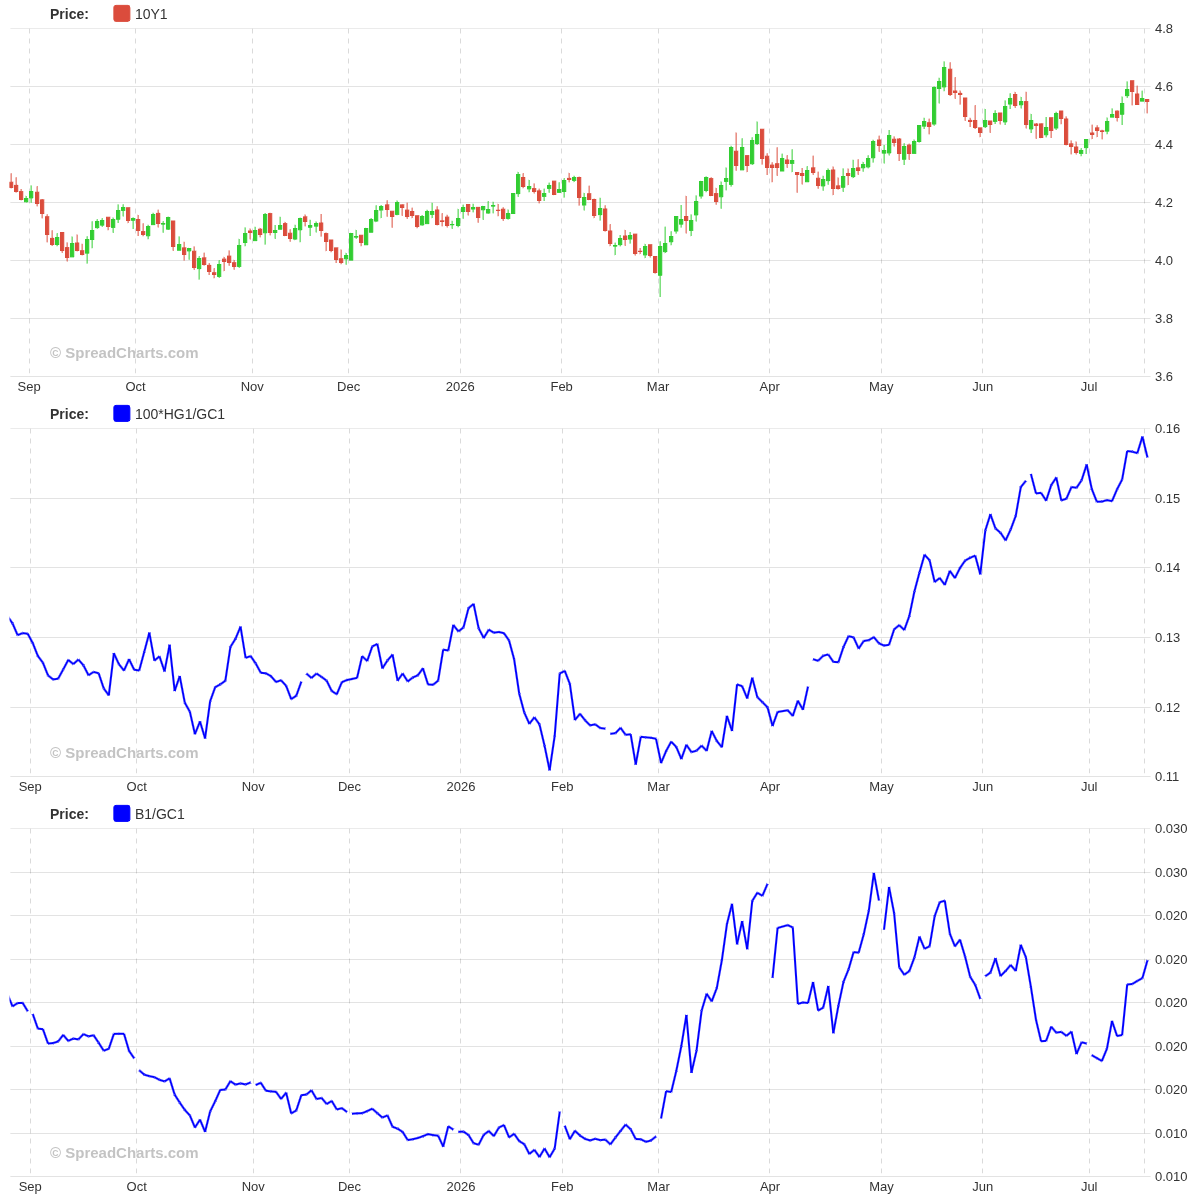
The next new addition is the Three-Month €STR contract. It’s a short-term interest rate futures contract on euro deposits. You can think of it as being similar to the 3-month SOFR futures contract for the US dollar.
That also implies potential use cases. Apart from actual rates traders, everyone can use it to gauge market expectations regarding ECB monetary policy. And that’s crucial for the euro, especially when you compare €STR rates with US rates – just take a look at the chart below, with the €STR-SOFR spread compared with euro futures.
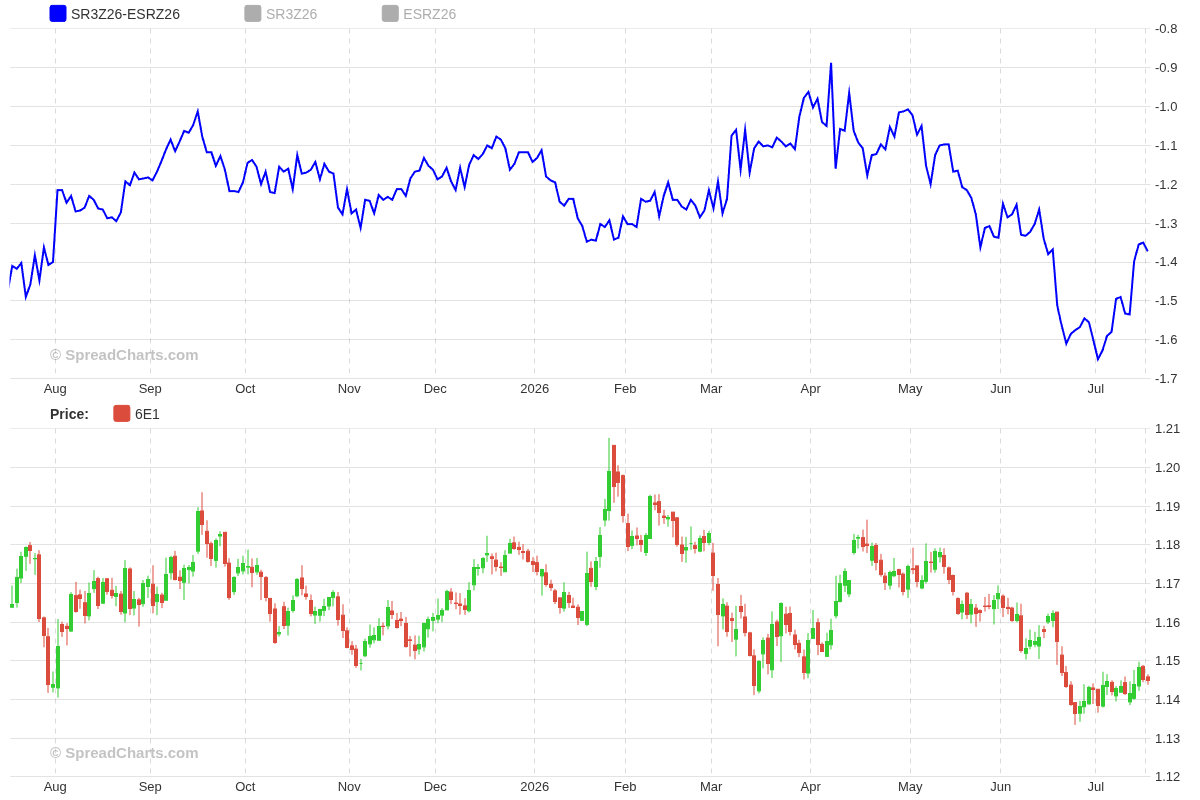
The next batch of new data is even more interesting – credit futures. We have added data for Bloomberg Investment Grade (IQB) and High Yield (HYB) Credit futures, allowing you to follow this critical data for the US economy.
I would especially point out the duration-hedged DHB (for investment grade) and DHY (for high yield) contracts. These futures essentially track credit spreads, which are key components of every macroeconomic model. Moreover, credit spread data is hard to obtain due to licensing requirements, which explains why retail traders often use ETFs as proxies, even for analytical purposes.
Take, for example, this bullish divergence between the IG credit spread and the S&P 500. Pretty helpful, isn’t it?
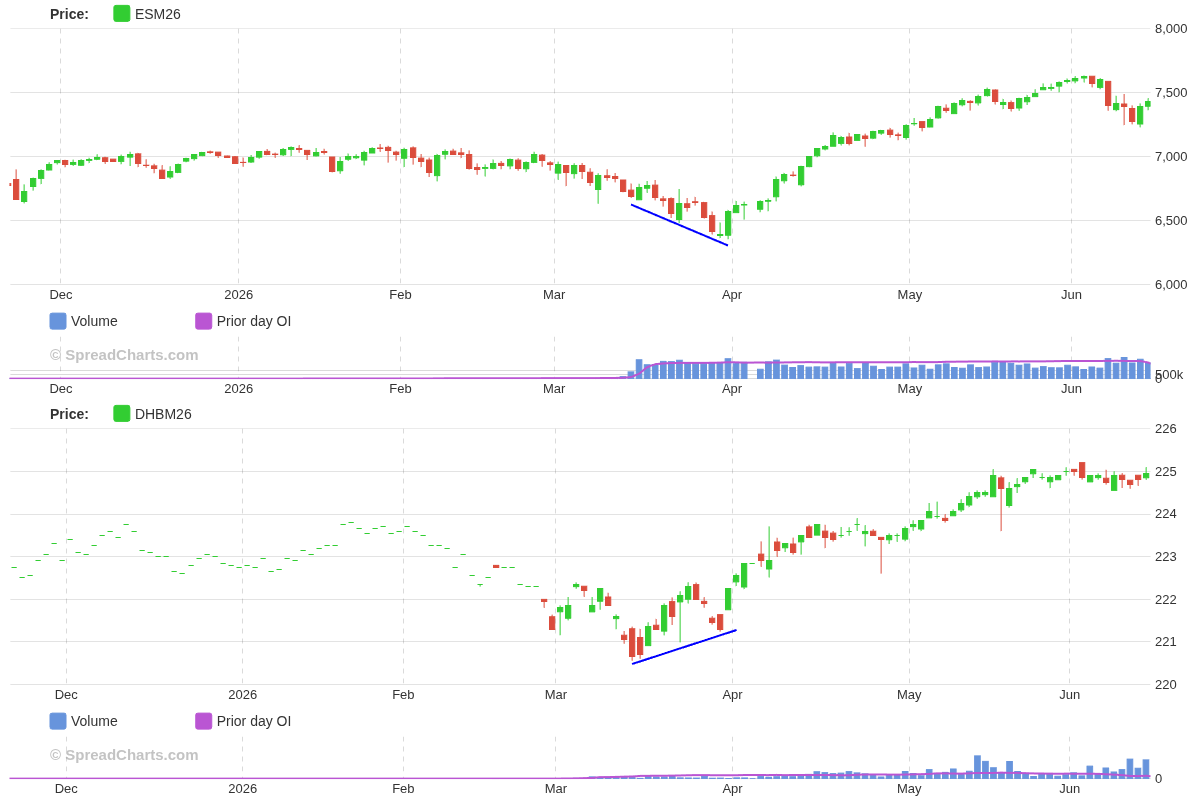
Besides interest rates, we also added data for selected electricity futures in Europe. This was requested by one of our subscribers, as they trade these products, and we were happy to accommodate them. But I’m sure this data can be useful for analytical purposes to a wider audience – for example, people trading natural gas.
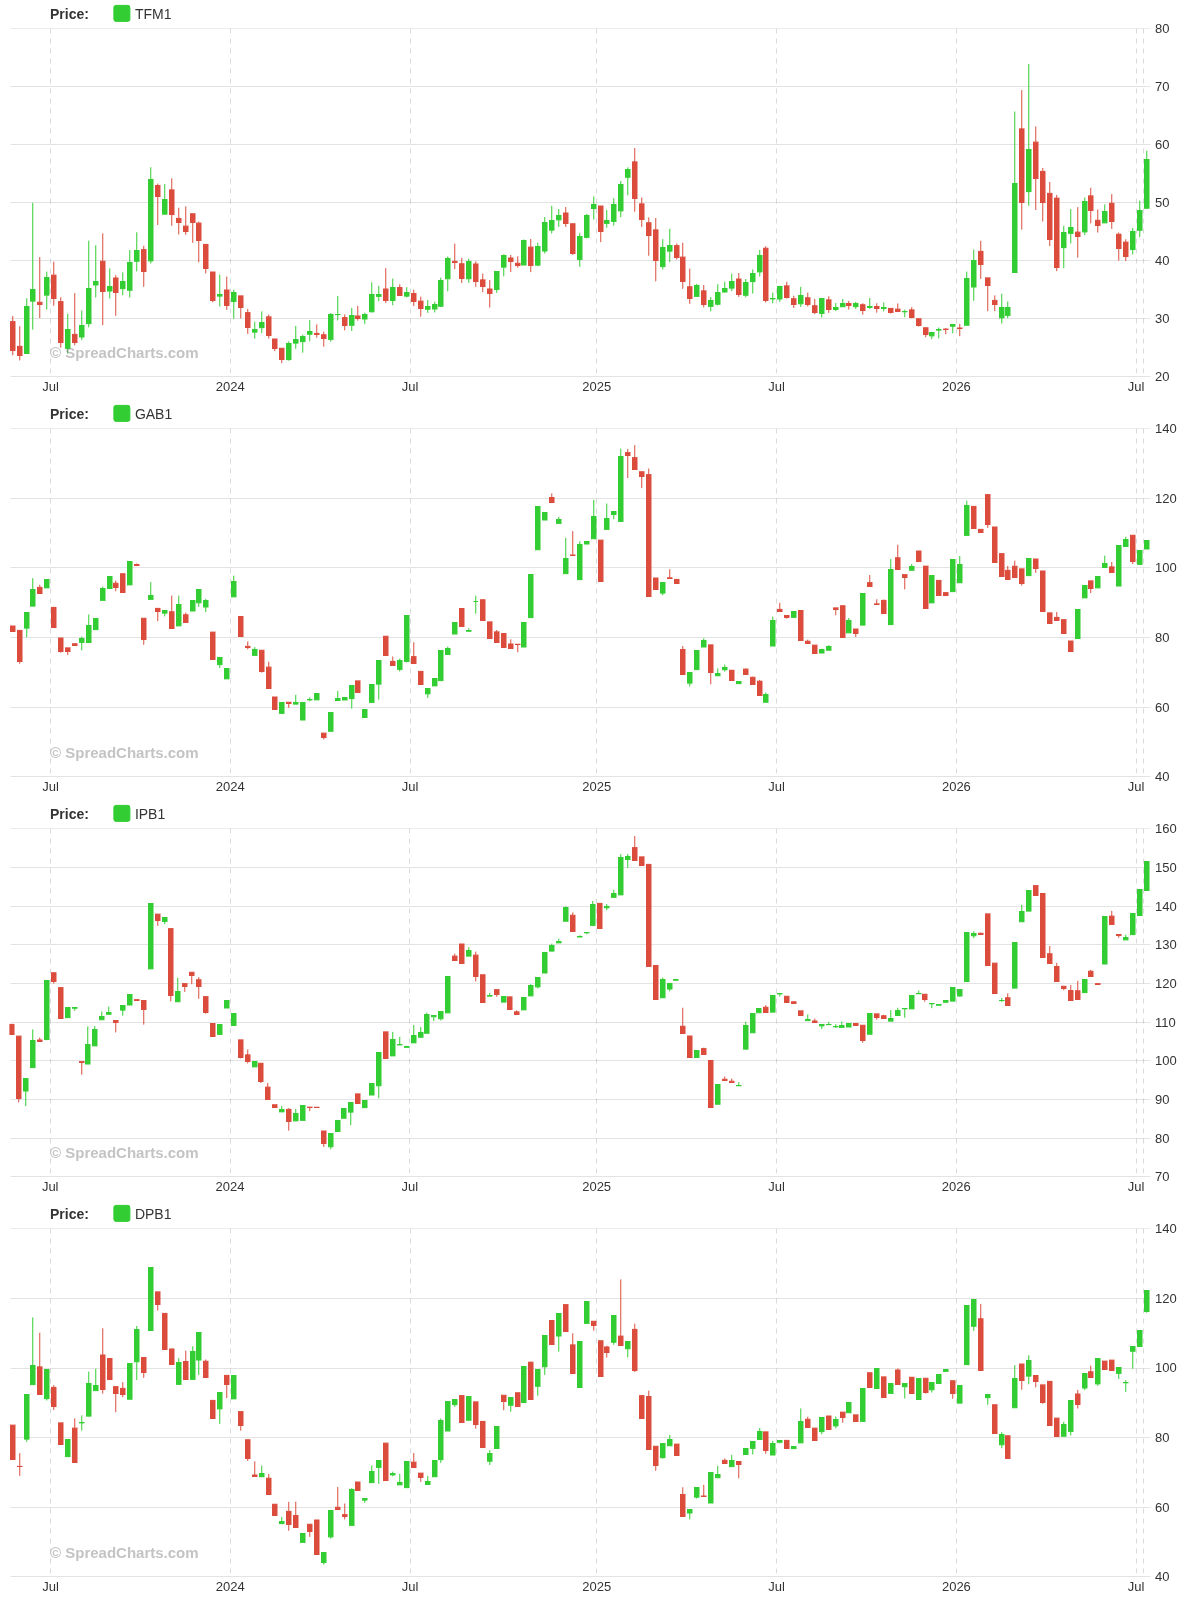
Below is an example of German, Italian and Dutch Power Base continuous contracts compared with TTF natural gas futures at the top.
I hope you’ll find the new data helpful in your analytical process, and I can promise you that the market data expansion is not over yet.
Check out these great articles as well
Pavel HálaLaunching indicators
Technical indicators are the favorite tool of roughly 95% of traders. Well, I’m in the...
Read morePavel HálaQuarterly macro outlook and review
We’ve just released the new Quarterly Macro Outlook, covering the latest trends in interest rates,...
Read morePavel HálaNormalized COT
We added a neat new feature for Commitments of Traders data. You can now normalize...
Read morePavel HálaNew data: Sector indices
Our software is already established well beyond commodity market analysis. Stock indices, currencies, and even...
Read more